
One of the frustrating situations I often encounter when debugging JavaScript, is tracking down JavaScript errors to line 23 col 63475. I felt as though I was right on the edge of seeing the offending code and being able to fix it. And then, reality came crashing down. I realized that I’ve managed to debug myself right into the middle of a minified JavaScript file .
There is a better way - Source Maps. JavaScript source maps are the key to taking what you’ve narrowed down in the minified code, and then being able to map them back to the source code so that you can view and resolve the problem without having to figure it out in the minified code.
Source maps are generated when JavaScript code is minified. By using the source map in production, you can trace your problems back to the exact line of source code. It also allows you to use your browser's developer console to step through the source code when debugging problems. We’ll look at how to generate a source map, and then we’ll look at how they work, and how we can use them to make our lives easier.
You can download or clone the source for the following demo from https://github.com/echovue/javascript-calculator. The source includes the original JavaScript file, the minified JavaScript file, and the source map. If you already know how to generate a source map or just want to use the generated file, you can skip down to How Do Source Maps Work?
Generating a Source Map
For this example, I’m going to be using a simple JavaScript application. Keeping it simple will help keep the demo manageable, and the concepts apply to any application, no matter the size.
The first thing that we’ll need is a tool to minify the code. I’m going to use UglifyJS, but most tools should support the ability to generate a production source map as part of the minification process. You can install UglifyJS with npm if you have that installed on your workstation.
$ npm install uglify-js -gYou can then validate installation by executing the following:
$ uglifyjs --version
uglify-js 3.2.0
In some cases, you may have to add the installation folder to your path.
Now that we have uglifyjs installed and we’ve verified that it works, let’s minify our code. If you’re using the example project, this command will overwrite the existing minified file and source map.
From the JS folder of the demo project, enter the following command.
$ uglifyjs calculator.js --compress --mangle --source-map --output calculator.min.jsThis command takes our JavaScript file calculator.js and converts it to a minified version calculator.min.js, along with a source map calculator.min.js.map. Even with this small file, the minification process reduces the size of the file from 4KB to 1KB.
How do Source Maps Work?
Source maps describe how the compiled code is related to your original source code. The debugger can then show the original code you wrote, while actually running the compiled code.
Let’s open up the source map file to see what it has in it. I used a JSON parser to format it for easy reading, and shortened some of the lines with ellipses as well.
{
  "version" : 3,
  "sources" : [calculator.js],
  "names" : [resultNum,operator,el,element,charAt,document,querySelector,...],
  "mappings" : CAAC,WACC,aAyGA,IAAK,IAvFHA,EACAC,EAhBEC,EAAK,SAASC,GAChB,MAA0B,MAAtBA,...
}
The file specifies the mapping version used and identifies the source files and names of parameters. The useful part is the mappings, although unfortunately since they are in Base 64 VLQ, they’re not very useful for the human brain.
If you’d like to understand more about how the mappings work, and how they translate the minified code back to the source, I’d recommend reading How do source maps work. For now, let’s look at how to leverage the source map in production to make debugging easier.
If you open the index.html in Chrome or your browser of choice, you’ll notice that there is a JavaScript error which is thrown on the first line of our minified file. Let’s make it easier to identify and resolve this.
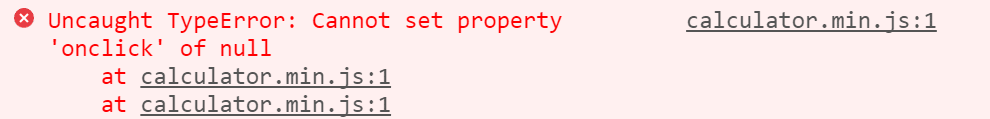
{: .imgcaption}
Figure 1. Error within the minified JavaScript file
Note: To complete the next set of steps, you will need to have the JavaScript-calculator web application running on a publicly accessible web server. For this demo, I created an AWS instance, installed an Apache Web Server, and served the web application from there.
Working with Source Maps in Production
When you’re debugging a production application, it gets trickier since production servers often don’t serve source maps. Do you want to make it easier for people you don’t know to see your raw source code? Fortunately, Rollbar supports using source maps to get meaningful stack traces while still using minified JavaScript in production.
Rollbar provides real-time production error monitoring with support for most programming languages, source maps, and frameworks, including JavaScript, Angular, Node, React, etc. Because rollbar,js supports source maps, you can see the line of exact code where each error originated along with the stack trace. Let’s dive into an example of how it works.
Once you have created an account and your first project, you’ll be given a client-side access tokens. Add the script included under the Quick start browser section inside the <HEAD> tag in index.html.
You can upload your source maps via the API. Usually, we would use a script do this automatically at deployment time, but we will do it manually for this tutorial. From the root folder of the web application project, execute the following curl command after updating the access token and the minified_url to your token and URL:
$ curl https://api.rollbar.com/api/1/sourcemap \
-F access_token=8888888888888888888888888 \
-F version=0.0.1 \
-F minified_url=http://ec2-52-43-138-168.us-west-2.compute.amazonaws.com/javascript-calculator/js/calculator.min.js \
-F source_map=@js/calculator.min.js.map \
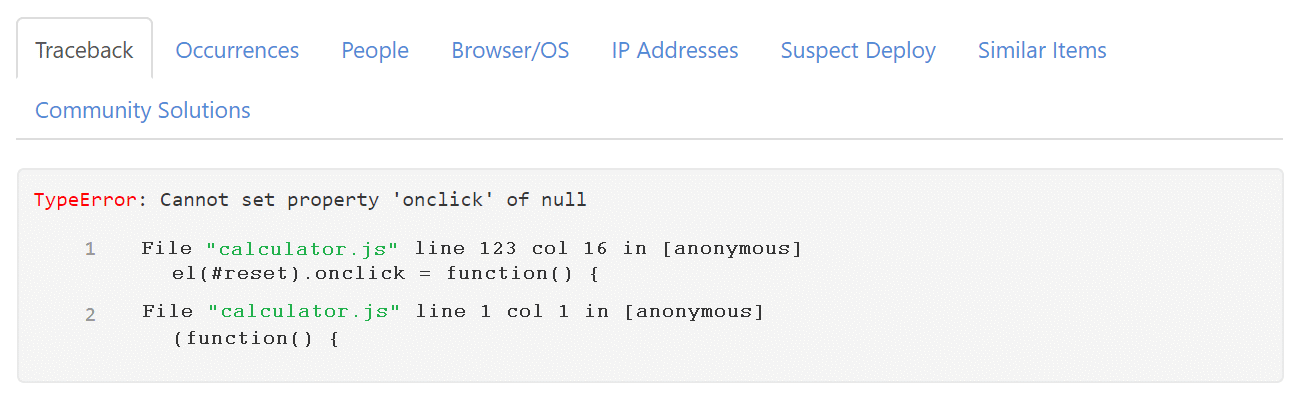
-F calculator.js=@js/calculator.jsOnce that is done, clicking on an error should take you to a page with the stack trace. Here we can see the proper source code with files, line numbers from the source map.
When you click the source file link, it will open to the file and line number in GitHub, BitBucket, or GitLab. There, you can use the tools to see what changes were made and when. To learn more, check out the source maps documentation for additional details and config options.
Tips for using source maps in production and debugging with Rollbar
- Don't forget to update the version number when you update your JavaScript. If you don't, the filename, line and column numbers will be incorrect.
- The value of
minified_urlmust be the full URL of the minified file. This should start withhttp:orhttps:, which we'll strip off. - Make sure you're not missing one or both of the config params in the on-page JavaScript snippet. Set both
payload.client.javascript.source_map_enabledandpayload.client.javascript.code_version. - If you're using the upload method, check to be sure that the
code_versionused in the on-page snippet matches the version provided in the upload call. - If you're using the download method, make sure your source map file or minified JavaScript source files are on a host that's reachable from the public internet and are not gated behind an authorization wall.
- If the JavaScript error that you are expecting to be un-minified does not have column numbers, and you haven't enabled
guess_uncaught_frames, we won't be able to apply the source map. We need column numbers to be able to apply the source map without guessing. - If your source map file combines multiple sub-maps into "sections" within the top level map, we, unfortunately, don't yet support this source map format (but we are planning to soon).
TL;DR
In conclusion, source maps help you debug production code right in your browser's developer console. They tell you the exact file and line number when there is an error, and make it natural to use the debugging feature within your browser to step through the code. This makes it much easier to find the root cause of problems and fix them quickly. When monitoring production systems, make sure to choose solutions like Rollbar that support source maps and make debugging production super easy.
If you haven’t already, sign up for a 14-day free trial of Rollbar and let us help you take control of impactful JavaScript errors.