

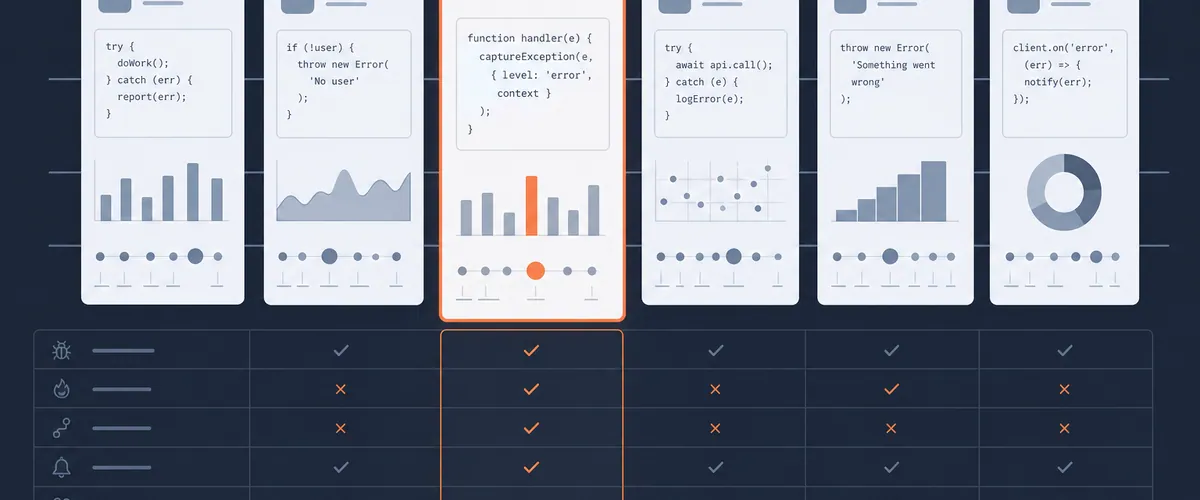
Bugsnag has been a solid error monitoring choice for years, especially for mobile teams shipping on iOS, Android, and game engines like Unity. But if you’re reading this, something isn’t working anymore.
Maybe your bill jumped after SmartBear folded Bugsnag into its broader platform. Maybe you’ve outgrown breadcrumb-based debugging and want session replay without bolting on another vendor. Maybe you’re tired of configuring static alert rules every time your team ships a new service.
You’re not alone. Many teams are re-evaluating their error-monitoring stack in 2026, and the landscape has shifted. Tools that were once niche now include out-of-the-box replay, AI triage, and release-aware alerting. Others have moved upmarket into full observability suites that might be more (or less) than you need.
This is an honest comparison. We’ll cover where Rollbar fits, where it doesn’t, and where other tools might be the better pick for your team.
TL;DR
- Rollbar is the strongest Bugsnag alternative for JS-heavy product teams that want session replay, adaptive alerts, and release-first error tracking bundled in every plan, starting at $9/mo.
- Sentry is the broadest alternative if you want error monitoring, tracing, logs, and profiling under one roof. Expect a higher starting price ($26/mo) and more configuration surface.
- Airbrake is the simplest option for small teams that want error monitoring without the complexity. No replay, no adaptive alerts, but it’s clean and predictable.
- PostHog combines product analytics with lightweight error tracking. Good if you’re already in the PostHog ecosystem; limited if error monitoring is your primary need.
- Datadog makes sense if your team already uses it for infrastructure monitoring and wants to consolidate. Error tracking is part of a larger (and more expensive) APM suite.
- Grafana Faro is a lightweight, open-source frontend observability agent. Strong choice for teams already running Grafana and comfortable self-hosting signal pipelines.
- Bugsnag remains a solid pick for mobile-first teams, especially those shipping on Unity, Unreal Engine, or Nintendo Switch.
Why teams look for Bugsnag alternatives
Three patterns drive most Bugsnag migrations:
Pricing shifts after the SmartBear acquisition. Bugsnag’s independent pricing was predictable. Since the acquisition, some teams have reported increases in billing as Bugsnag features are bundled into SmartBear’s broader platform strategy. Per-feature pricing means that capabilities other tools include by default (like session replay or advanced alerting) may cost extra.
No native session replay. Reproducing errors from breadcrumbs and device metadata alone is a guessing game. In 2026, session replay tied directly to error events is table stakes for frontend and full-stack teams. Bugsnag doesn’t offer it. If you want to see what the user actually did before the crash, you need a separate tool.
Static alert rules that don’t scale. Bugsnag’s alerting relies on manually configured rules per project. For teams shipping multiple services across multiple environments, maintaining those rules becomes a job in itself. Adaptive alerting, where thresholds learn from your error patterns, isn’t part of the Bugsnag model.
Error context and root cause: what you actually see when something breaks
Error monitoring tools capture stack traces. The difference is what they show you around the stack trace.
Bugsnag gives you the stack trace, breadcrumbs (user actions leading up to the error), device metadata, and app state. It’s solid for identifying what happened. Getting to why often means switching to logs, asking the user to reproduce, or guessing at the sequence of events. For mobile apps, Bugsnag’s breadcrumb system is particularly well-tuned, capturing navigation events, network calls, and lifecycle transitions with minimal SDK overhead.
Rollbar pairs every error with session replay, so you can step through exactly what the user did before the crash. No reproduction steps needed. Errors link directly to the replay event, the deploy that introduced the issue, and the code owner responsible for that service. The replay is tied to the error occurrence, not a separate recording you have to correlate manually.
Sentry offers a similar error-plus-replay model and adds distributed tracing and log correlation. If your debugging workflow starts at a trace and works backward to the error, Sentry’s model is well-suited. The tradeoff is surface area: there’s more to configure and more data to manage.
Airbrake keeps it simple. Stack traces, error grouping, and a clean interface. No replay, no tracing, no AI triage. If your team’s debugging workflow is “read the stack trace, check the deploy, fix the code,” Airbrake won’t get in your way.
PostHog captures session replays natively (it’s a product analytics tool at heart), but its error tracking is newer and less mature than purpose-built tools. You get the replay context, but error grouping, regression detection, and alert routing are still catching up.
Datadog surfaces errors in its APM product, giving you trace-linked error context and infrastructure correlation. If you need to see whether an error spike correlates with a CPU spike on a specific host, Datadog excels. But error monitoring alone is not a standalone Datadog product; you’re buying into the broader platform.
Grafana Faro is a lightweight JavaScript agent that captures frontend errors, Web Vitals, and user sessions and sends them to your existing Grafana stack. The context you get depends on what you’ve built on top of it. It’s powerful if your team already operates Grafana, Loki, and Tempo, but it requires you to build the correlation layer yourself.
Release tracking and regression detection: catching what your deploy broke
Error counts matter less than error trends, and the most important trend is: did this deploy introduce new errors or resurface old ones?
Bugsnag tracks release stability and lets you compare error rates across versions. It handles this well for mobile releases, where version numbers are meaningful and rollbacks are slow. The workflow is somewhat siloed though: you’re comparing versions within Bugsnag’s release dashboard rather than seeing release health as a first-class lens across your error feed.
Rollbar takes a release-first approach. Every error is tagged by deploy version automatically. Regressions (errors that were resolved and then resurfaced) trigger alerts to the code owner, not just the on-call rotation. You see release health, new errors introduced per deploy, and version-over-version comparisons in a single view. This model was built for teams shipping web services multiple times a day, where the question isn’t “which version is the user on?” but “which deploy caused this?”
Sentry handles release tracking and regression detection well, with deploy-linked error timelines and the ability to mark releases and track adoption. Its release health dashboard gives you crash-free session rates and adoption curves, which are especially useful for mobile.
Airbrake tracks deploys but doesn’t have automated regression detection. You can correlate errors with releases, but you’ll need to spot regressions yourself by reading the error timeline.
PostHog and Grafana Faro don’t have built-in release tracking for error monitoring. You’d need to tag events manually or correlate through separate deploy tracking tooling.
Datadog ties errors to service versions through its APM traces, and its deployment tracking feature can correlate error spikes with specific deploys. It works, but it’s part of the APM workflow, not a standalone error monitoring feature.
Noise reduction and alert quality: not all alerts are signals
Alert fatigue is the silent killer of error monitoring adoption. If every alert feels like noise, your team stops looking.
Bugsnag offers filtering and spike detection, but fine-tuning thresholds means manual rules per project. For teams with a handful of services, that’s manageable. For teams with dozens of services and environments, it becomes a maintenance burden that nobody owns.
Rollbar uses adaptive alerts that learn from your error patterns and adjust thresholds automatically. Combined with grouping that deduplicates by root cause rather than message string, the net effect is fewer alerts that are more likely to be actionable. You configure the alert destinations (Slack channel, PagerDuty, Jira ticket) and Rollbar tunes the triggers.
Sentry has improved its alerting significantly, with issue-level alerts, metric alerts, and anomaly detection. The configuration surface is broader than Rollbar’s, which gives you more control but also more knobs to turn. Teams that want fine-grained control over alert conditions will find Sentry’s model flexible.
Airbrake sends alerts on new errors and error spikes. The rules are straightforward but static. If that’s all you need, it works. If you want your alerting to evolve as your error landscape changes, you’ll hit a ceiling.
PostHog has basic alerting for error events, but it’s not the tool’s focus. Don’t expect the same depth as purpose-built error monitoring.
Datadog has a mature alerting system across its entire platform, including anomaly detection, composite alerts, and SLO-based triggers. If your team already uses Datadog monitors for infrastructure, adding error-based alerts is natural. The complexity is in managing the alert sprawl that comes with a platform this broad.
Grafana Faro relies on Grafana’s alerting infrastructure (Alertmanager, Grafana Alerts). You can build sophisticated alert rules, but you’re building them, not configuring them. The upside is total control. The downside is total responsibility.
Where Bugsnag is the better fit
Honesty matters more than positioning. There are cases where Bugsnag is genuinely the right choice:
Mobile-first teams, especially gaming. Bugsnag’s mobile SDK coverage is deep. It supports Unity, Unreal Engine, Nintendo Switch, Cocos2d-x, and Xamarin alongside standard iOS and Android. If your primary codebase runs on a game engine, Bugsnag’s error monitoring is purpose-built for that world. Rollbar and Sentry cover iOS and Android, but neither has the same depth in game engine support.
Teams already deep in the SmartBear ecosystem. If your QA workflow uses SmartBear tools (TestComplete, CrossBrowserTesting, AlertSite), Bugsnag’s integration into that ecosystem creates a tighter feedback loop between testing and production error monitoring.
Teams that need stability over features. Bugsnag’s feature set hasn’t changed dramatically in the last two years. For some teams, that’s a feature, not a bug. If your error monitoring workflow is established and working, and you’re not looking for replay or adaptive alerts, Bugsnag’s stability is a valid reason to stay.
Quick comparison
| Capability | Rollbar | Bugsnag | Sentry | Airbrake | PostHog | Datadog | Grafana Faro |
|---|---|---|---|---|---|---|---|
| Real-time error monitoring | Yes | Yes | Yes | Yes | Yes | Yes | Yes |
| Session replay linked to errors | Yes (all plans) | No | Yes (paid add-on) | No | Yes (via analytics) | Yes (via RUM) | Partial (requires Grafana stack) |
| Release-aware regression alerts | Yes | Partial | Yes | No | No | Yes (via APM) | No |
| Adaptive alert thresholds | Yes | No | No | No | No | Yes (anomaly detection) | Manual (Alertmanager) |
| Intelligent error grouping | Yes | Yes | Yes | Yes | Limited | Yes | Manual |
| Automated error assignment | Yes | Yes (Enterprise) | Yes | No | No | Yes | No |
| Game engine support (Unity/Unreal) | No | Yes | Yes (Unity) | No | No | No | No |
| Free plan | Yes (unlimited users) | No | Yes (1 user) | No | Yes | No | Yes (open source) |
| Starting price (paid) | $13/mo | ~$23/mo | $26/mo | $17/mo | $0 (free tier) | ~$31/mo (APM) | Free (self-hosted) |
Pricing as of mid-2026 based on publicly listed plans. Enterprise pricing varies.
How to choose the right Bugsnag alternative
Skip the feature matrix for a moment. The right tool depends on three things:
What’s your primary platform? If you’re building for web and JavaScript is your main stack, Rollbar and Sentry are the strongest fits. If you’re shipping mobile apps on game engines, Bugsnag might still be your best option. If you’re already running Grafana for infrastructure observability, Faro is worth evaluating before you add another vendor.
How does your team debug? If your workflow is “read the stack trace, check the diff, deploy a fix,” a simpler tool like Airbrake or Rollbar will serve you well. If you start from distributed traces and work backward, Sentry or Datadog fit that model. If you want to watch a replay of exactly what happened, Rollbar and PostHog prioritize that experience.
What are you actually paying for? Bugsnag’s per-feature pricing means you might pay for error monitoring, then pay again for features that other tools bundle in. Rollbar includes session replay and adaptive alerts on every paid plan. Sentry includes replay on paid plans but charges separately for higher volumes. Datadog’s pricing scales with your infrastructure footprint, which can be unpredictable. Grafana Faro is free if you self-host, but your team’s time building and maintaining the pipeline is a real cost.
The honest answer: if you need error monitoring with replay and release tracking for web applications, and you want it bundled rather than a la carte, Rollbar is worth trying. If your needs are broader (tracing, logs, profiling), Sentry or Datadog may be the better investment. If your needs are simpler, Airbrake won’t waste your time.
Migrating from Bugsnag to Rollbar
Switching error monitoring tools sounds painful. In practice, the migration is straightforward because you’re replacing one SDK with another, not re-architecting your stack.
Step 1: Install the Rollbar SDK. Rollbar supports 25+ languages and frameworks. Find your stack in the SDK docs and add the package. Most installations take under 5 minutes.
Step 2: Configure your access token and environment. Set your server-side and client-side access tokens, and tag the environment (production, staging, etc.). If you’re using Bugsnag’s releaseStage, the mapping is direct.
Step 3: Enable deploy tracking. Add a deploy notification to your CI/CD pipeline. A single POST request to Rollbar’s deploy API links every error to the code version that caused it. This replaces Bugsnag’s appVersion tagging and adds regression detection on top.
Step 4: Turn on session replay (frontend). Add the Rollbar snippet with replay enabled. This captures user sessions and links them directly to errors. There’s no separate replay SDK to install or configure.
Step 5: Configure alert routing. Connect your Slack channels, PagerDuty services, or Jira projects. Rollbar’s adaptive alerts start learning your error patterns immediately, so you don’t need to set manual thresholds.
Step 6: Remove the Bugsnag SDK. Once Rollbar is capturing errors in production and you’ve verified the data flow, remove the Bugsnag package and configuration. Run both in parallel for a deploy cycle or two if you prefer a gradual cutover.
The full migration typically takes an afternoon for a single-service app, or a sprint for teams with multiple services and environments.
FAQ
Is Bugsnag still a good error monitoring tool in 2026?
Yes, especially for mobile-first teams and teams shipping on game engines like Unity and Unreal. Bugsnag’s mobile SDK coverage is among the deepest in the market. Where it falls short is on web-focused features like session replay, adaptive alerting, and bundled pricing. If your primary stack is JavaScript or Python and you want replay included, a tool like Rollbar or Sentry is likely a better fit.
How long does it take to migrate from Bugsnag to Rollbar?
Most teams complete the migration in an afternoon for a single service. The process is: install the Rollbar SDK, configure your access token, enable deploy tracking in CI/CD, turn on session replay for frontend apps, and set up alert routing. For teams running multiple services, plan for a sprint with parallel monitoring during the transition.
Does Rollbar offer a free plan?
Yes. Rollbar’s free plan includes 5,000 events per month with unlimited users and no credit card required. It includes core error monitoring, error grouping, and basic alerting. Paid plans start at $13/month and add session replay, adaptive alerts, and higher event volumes.
