A Java stack trace is the block of text Java prints when an exception or error goes uncaught. It lists, in order, every method call that was active at the moment the error happened, starting with the exception itself and ending with where the program started. Reading it top to bottom tells you what went wrong; reading it bottom to top tells you how the code got there.
Stack traces aren't just for crashes, either. You can print one deliberately with Thread.dumpStack() or e.printStackTrace() to log the current call path even when nothing has gone wrong.
In this guide I'll break down what a stack trace contains, walk through several examples (including what it looks like when one exception triggers another), show you the Java methods used to work with them programmatically, and cover how to actually handle exceptions so you don't have to stare at one at 2 a.m.
Anatomy of a Stack Trace
Every Java stack trace is built from the same pieces, no matter which exception triggered it. Here's an example of a stack trace and what each part means:
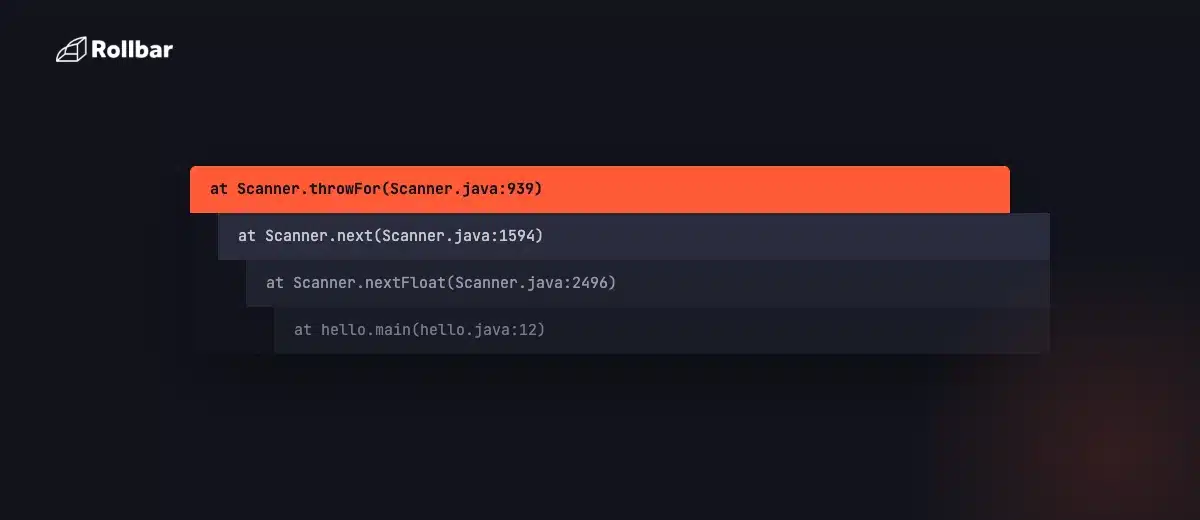
Exception in thread "main" java.util.InputMismatchException
    at java.base/java.util.Scanner.throwFor(Scanner.java:939)
    at java.base/java.util.Scanner.next(Scanner.java:1594)
    at java.base/java.util.Scanner.nextFloat(Scanner.java:2496)
    at com.example.myJavaProject.hello.main(hello.java:12)
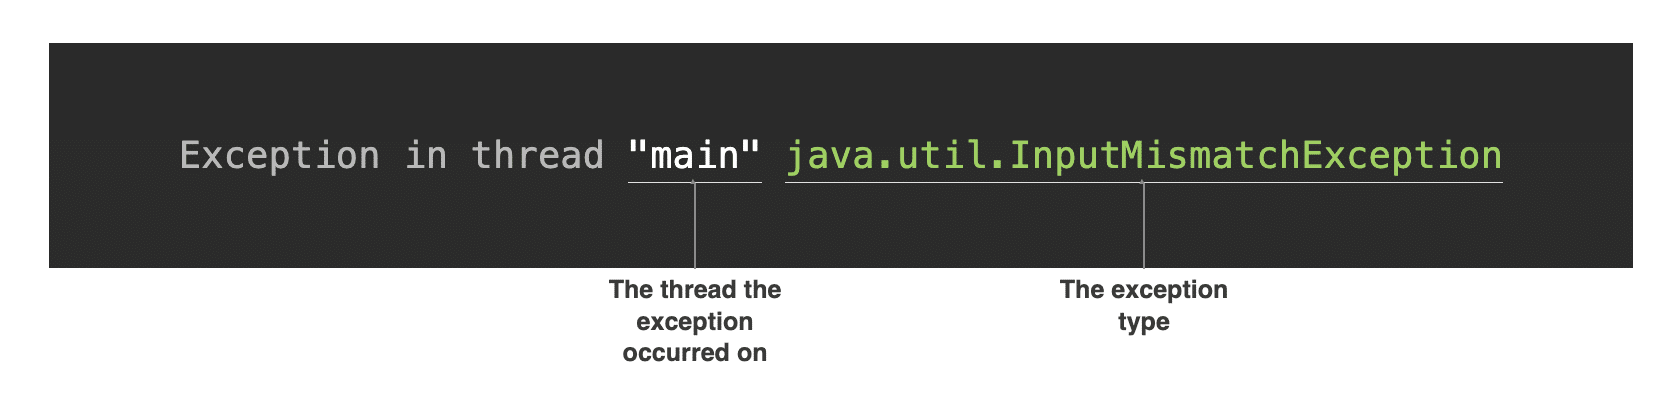
Exception in thread "main" means which thread the uncaught exception happened on. Most simple programs only have the main thread.
java.util.InputMismatchException is the fully qualified exception type. This alone tells you the category of problem (here, a type mismatch reading input).
Sometimes there's an optional message. Some exceptions append a message after a colon (e.g. NullPointerException: Cannot invoke "String.length()" because "s" is null). Not every exception, like the one in the example, includes one.
Next there's the "stack frame":
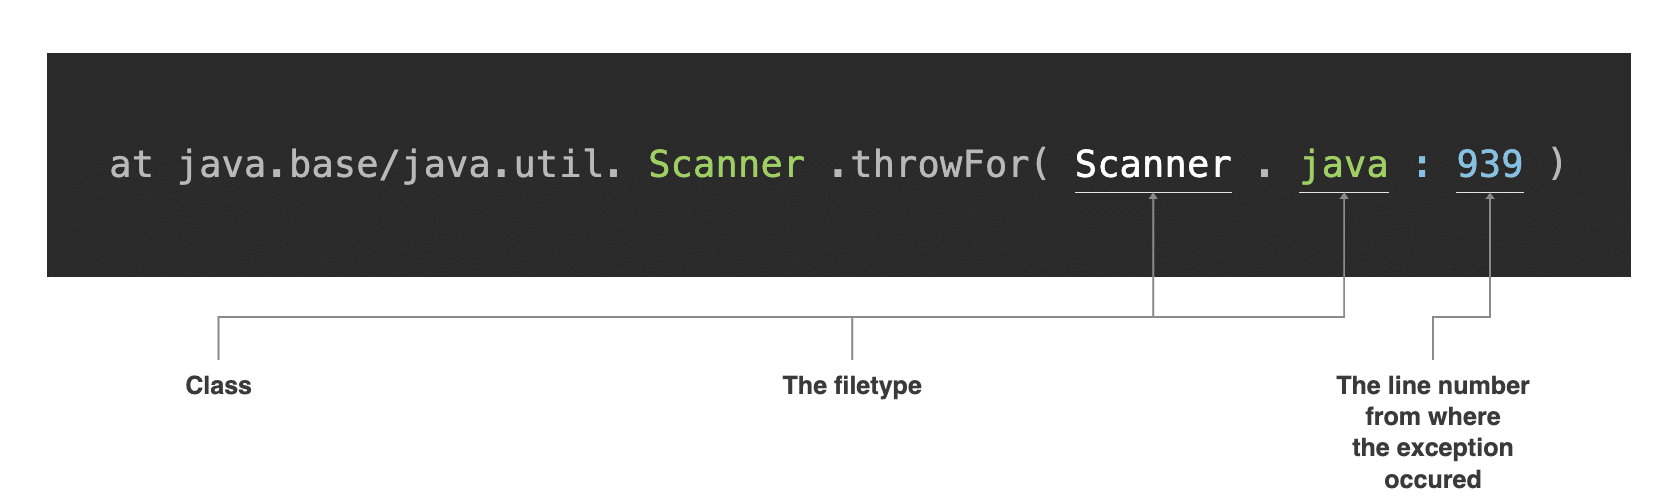
The at … lines are called a "stack frame". Each method call is formatted as package.Class.method(File.java:lineNumber). Each frame is one level of the call stack at the moment the exception was thrown.
Order matters. The frames are printed newest-first. The top line is where the exception was actually thrown; the bottom line is closest to where your program started.
How to Read a Stack Trace (Step by Step)
Whatever the exception, the reading strategy is the same:
- Start at the top line to identify the exception type and message. This tells you what kind of error occurred.
- Read the frames top to bottom until you hit a line that mentions your own code (your package name), not JDK or library internals. That's usually your actual bug.
- Read bottom to top if you want to understand the call path. The bottom frame is the earliest call (often
main), and each frame above it is a method that call led to. - Ignore frames you don't own, at least at first. JDK-internal frames (
java.base/…) tell you where the failure surfaced, but the fix is almost always in the first frame that belongs to your package. - Look for "Caused by:". If present, the real root cause is often further down that secondary trace, not the top one (see the chained example below).
Applying that to the trace above: the exception type is InputMismatchException. Reading upward from main, nextFloat() called next(), which called throwFor() — that's where the exception was actually raised. Tracing it back to main() at the bottom shows the failure happened while reading user input, which matches what the code was doing.
Examples of Java Stack Traces
Example 1 — Temperature Conversion (Uncaught Exception)
Only an integer or float input is valid here. If we provide another data type, such as a string, the JVM throws an exception and prints the stack trace automatically.
import java.util.Scanner;

public class hello {
    public static void main(String[] args) {
        Scanner scanner = new Scanner(System.in);

        System.out.print("Enter value in Celsius to convert in fahrenheit:");

        double Celsius = scanner.nextFloat();
        double fahrenheit = (Celsius * 1.8) + 32;

        System.out.printf("%.1f degrees Celsuis is %.1f degrees in Fahrenheit ", Celsius, fahrenheit);
    }
}
Entering the string "hero" produces:
Enter value in Celsius to convert in fahrenheit: hero
Exception in thread "main" java.util.InputMismatchException
    at java.base/java.util.Scanner.throwFor(Scanner.java:939)
    at java.base/java.util.Scanner.next(Scanner.java:1594)
    at java.base/java.util.Scanner.nextFloat(Scanner.java:2496)
    at com.example.myJavaProject.hello.main(hello.java:12)
Example 2 — Function Chaining (Manually Printed Trace)
No exception is thrown here — the trace is explicitly printed with Thread.dumpStack(), which is useful for logging the current call path (e.g., to confirm a method is being reached, or to log context around a warning).
public class Example {
    public static void main(String args[]) {
        f1();
    }

    static void f1() { f2(); }
    static void f2() { f3(); }
    static void f3() { f4(); }
    static void f4() { Thread.dumpStack(); }
}
Output:
java.lang.Exception: Stack trace
    at java.base/java.lang.Thread.dumpStack(Thread.java:1380)
    at com.example.myJavaProject.Example.f4(Example.java:25)
    at com.example.myJavaProject.Example.f3(Example.java:20)
    at com.example.myJavaProject.Example.f2(Example.java:15)
    at com.example.myJavaProject.Example.f1(Example.java:10)
    at com.example.myJavaProject.Example.main(Example.java:6)
Example 3 — Chained Exceptions ("Caused by:")
In real applications, you'll very often see a stack trace with a "Caused by:" section. This happens when code catches one exception, wraps it in a new one for context, and rethrows it — a common and encouraged pattern.
public class ResourceLoader {
    public static void main(String[] args) {
        loadConfig();
    }

    static void loadConfig() {
        try {
            readFile();
        } catch (Exception e) {
            throw new RuntimeException("Failed to load configuration", e);
        }
    }

    static void readFile() throws Exception {
        throw new java.io.FileNotFoundException("config.yaml not found");
    }
}
Output:
Exception in thread "main" java.lang.RuntimeException: Failed to load configuration
    at com.example.myJavaProject.ResourceLoader.loadConfig(ResourceLoader.java:10)
    at com.example.myJavaProject.ResourceLoader.main(ResourceLoader.java:3)
Caused by: java.io.FileNotFoundException: config.yaml not found
    at com.example.myJavaProject.ResourceLoader.readFile(ResourceLoader.java:15)
    at com.example.myJavaProject.ResourceLoader.loadConfig(ResourceLoader.java:8)
    ... 1 more
The key point is this: the top exception (RuntimeException) is only the wrapper; it tells you where the failure surfaced. The real root cause is under Caused by: (FileNotFoundException), which tells you why it actually happened:
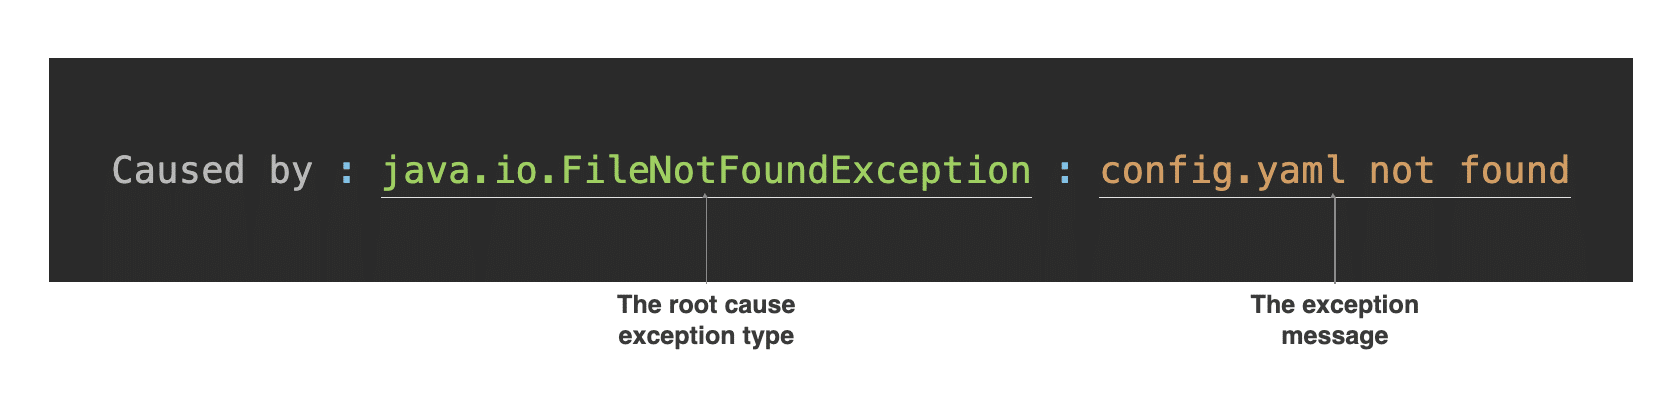
Always read down to the last "Caused by" block before deciding where to fix the code. The ... 1 more line means the remaining frames are identical to the outer trace and Java collapses them to keep the output shorter.
printStackTrace() and Other Ways to Work With Stack Traces in Java
Java's Throwable class (the superclass of all exceptions and errors) gives you a few built-in ways to access or print a stack trace directly in code:
System.err). The most common way stack traces appear in console output and logs.e.printStackTrace(PrintWriter)
StackTraceElement[] array instead of printing it, so you can inspect or log it programmatically. Each element exposes the class name, method name, file name, and line number.
try {
    riskyOperation();
} catch (Exception e) {
    e.printStackTrace(); // quick and common, but see the note below

    // or, to inspect frames programmatically:
    for (StackTraceElement frame : e.getStackTrace()) {
        System.out.println(frame.getClassName() + "." + frame.getMethodName()
            + " (line " + frame.getLineNumber() + ")");
    }
}
A word of caution: printStackTrace() is fine for local debugging, but it's a poor choice for production code. It writes to System.err with no log level, no timestamp, and no way to route it anywhere useful. Use a logging framework (or an error monitoring tool) instead, so traces are captured, searchable, and alertable rather than scrolling past in a console. See Oracle's official Throwable class documentation for the full method list.
Common Causes of Java Stack Traces
Stack traces show up whenever an unchecked condition trips at runtime. Some of the most frequent culprits:
Scanner (see Example 1).Exception or RuntimeException for domain-specific error handling.How to Avoid a Stack Trace With Error Handling
Since stack traces surface when exceptions go uncaught, the fix is to catch and handle them deliberately with try/catch.
import java.util.InputMismatchException;
import java.util.Scanner;

public class hello {
    public static void main(String[] args) {
        Scanner scanner = new Scanner(System.in);

        System.out.print("Enter value in Celsius to convert in fahrenheit:");

        try {
            double Celsius = scanner.nextFloat();
            double fahrenheit = (Celsius * 1.8) + 32;

            System.out.printf("%.1f degrees Celsuis is %.1f degrees in Fahrenheit ", Celsius, fahrenheit);
        } catch (InputMismatchException e) {
            System.out.println("Wrong input type entered...exiting the program");
        }
    }
}
Running it with the same bad input now gives a clean, controlled result instead of a crash:
 Enter value in Celsius to convert in fahrenheit: hero
Wrong input type entered...exiting the program

Process finished with exit code 0
The code that might fail goes in the try block; anything thrown inside it is caught and handled in the matching catch block. This is the standard, most widely used approach to preventing unhandled stack traces in Java.
Track, Analyze, and Now Fix Errors With Rollbar
Managing errors and exceptions in your code is challenging. It can make deploying production code an unnerving experience. Being able to track, analyze, and manage errors in real time helps you proceed with more confidence. Rollbar automates error monitoring and triaging, making fixing Java errors easier than ever.
And you don't have to stop at just monitoring: Rollbar Resolve takes it a step further by reviewing your codebase, figuring out what's actually causing a production error, and opening a pull request with a tested fix. So a stack trace like the ones above can go from "here's what broke" to a ready-to-merge PR, with a person still approving every change. Sign up for free today!