
Traditionally, Quality Assurance (QA) has been a very manual process. Our QA teams do an amazing job running through test plans, finding critical bugs, and logging reports. But it can be a lot of work to run through the tests again and again, dig into the errors to provide the contextual information developers need to fix bugs quickly, and prepare the reports your developers need to find and fix errors in the codebase.
Sometimes, even with all this support from the QA team, development teams may have to spend considerable time trying to reproduce errors and locating the relevant source code. And in this era of "doing more with less," not all dev teams are lucky enough to have dedicated QA support, so triaging bug reports is one more thing developers are responsible for.
With Rollbar's advanced reporting, reliability engineers can create reports to track performance and assess the effectiveness of staging and other pre-production phases. Test failures can also be associated with their original exceptions, providing software developers with rich context information.
The bottom line is that QA without Rollbar can be hard. With a little help from Rollbar, it's easier, faster, and provides more complete data for crushing bugs. We'll explain how in the rest of this article.
Demonstrating QA Error Monitoring with Rollbar
Let’s say you’re a developer working for a company that creates line-of-business applications. As part of the development lifecycle, your colleague Kendall from QA routinely sends you reports containing bugs you must understand, reproduce, and fix.
Kendall's QA practices include some automated steps, but mostly entail iterating over the test plan, stepping through test steps manually, and filling in bug reports for you. Here's a typical error report:
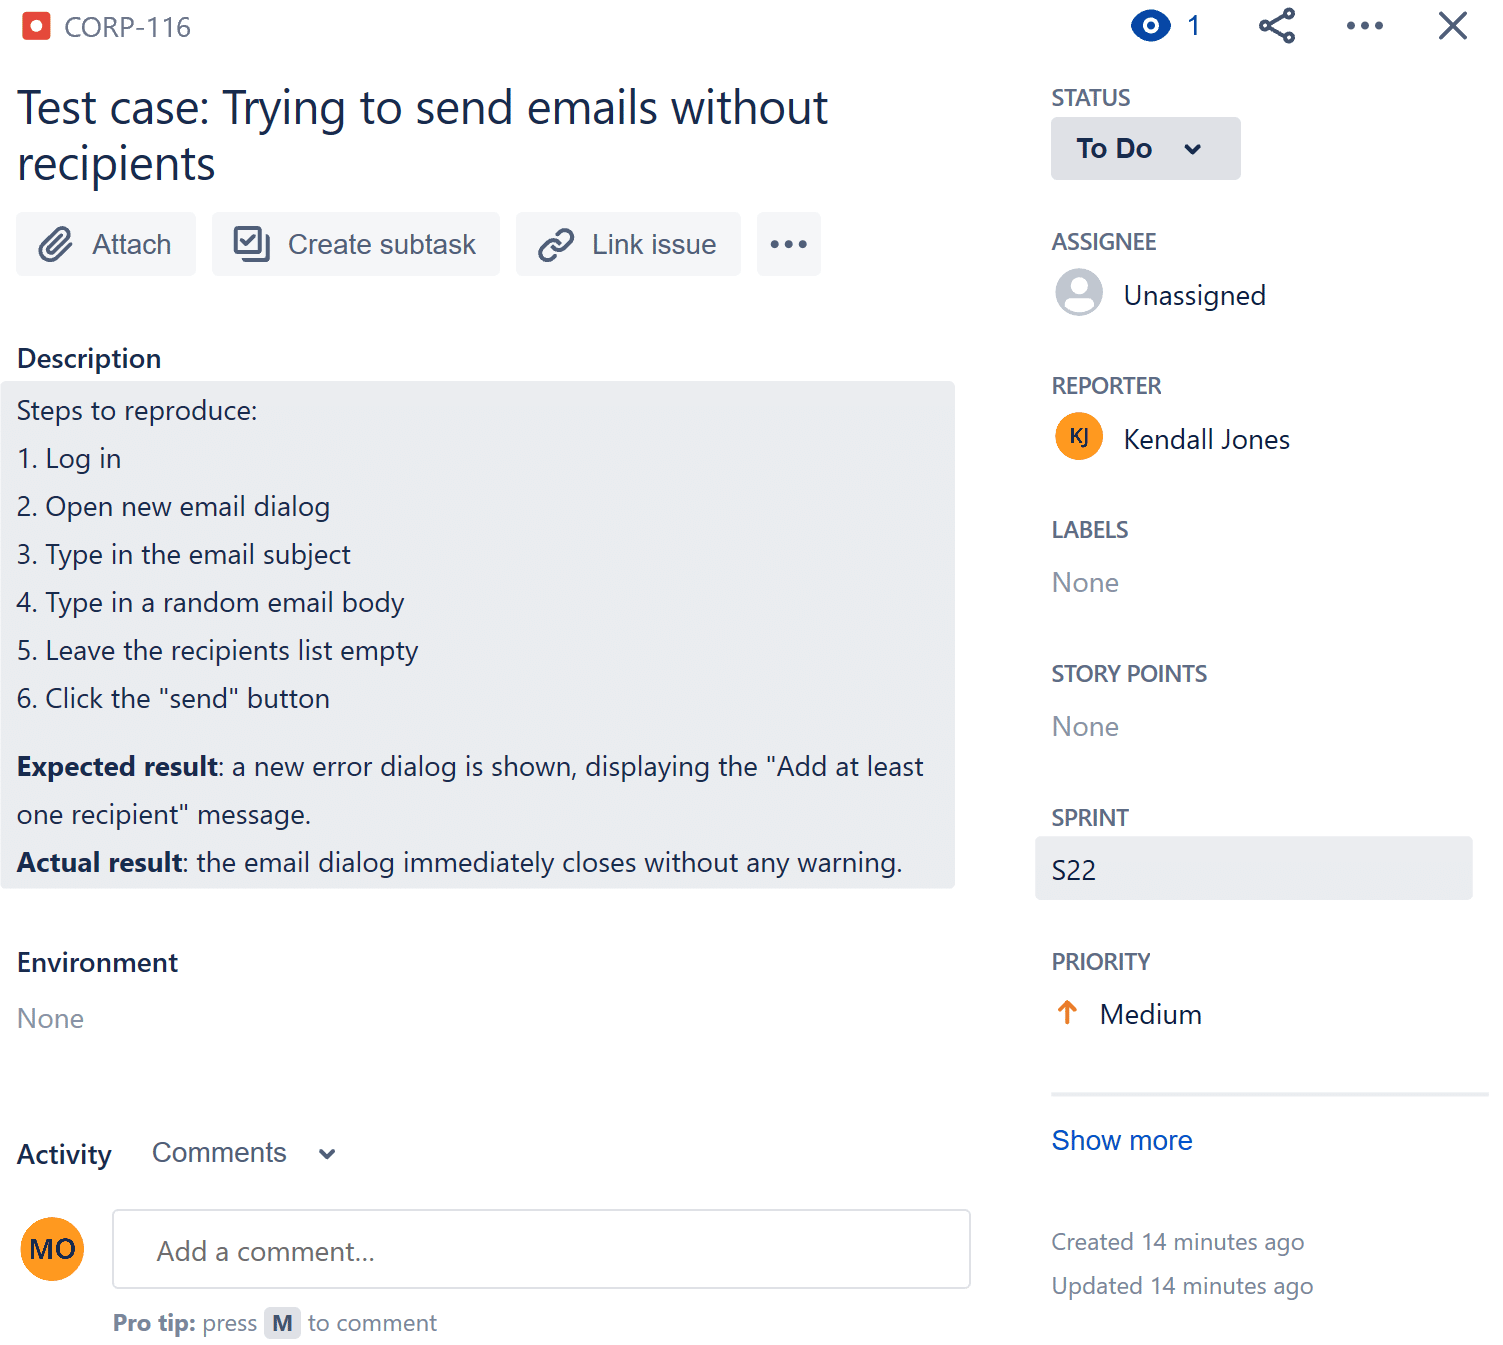
The reports provided by Kendall tell which defects were found, and even include the reproduction steps, but often don't include information about the underlying causes of the error.
An error report like this is a great start for investigating a bug and gives you, as the developer, a starting point to reproduce the error Kendall reported. Figuring out which lines of code from which components should be fixed is going to require digging deeper, typically a time-consuming task for the developer or QA engineer.
Rollbar makes it much easier to capture and report detailed error data automatically and quickly. With Rollbar you simply add lightweight, agentless error monitoring for front-end, back-end, and mobile platforms, including Ruby, Python, Node.js, PHP, JavaScript, Android, iOS, .NET, and Java.
Let's see how adding just a few lines of code to the app.js file to import and configure Rollbar module at the application startup can instantly introduce Rollbar monitoring to an existing Node.js app:
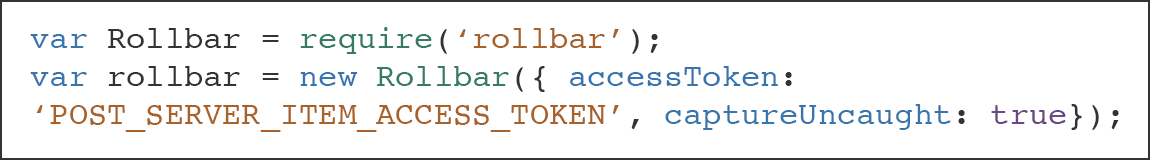
This code provides the Rollbar object with your access token, which is linked to your Rollbar account. Also, we are registering Rollbar as a handler for any uncaught exceptions thrown by your Node.js application.
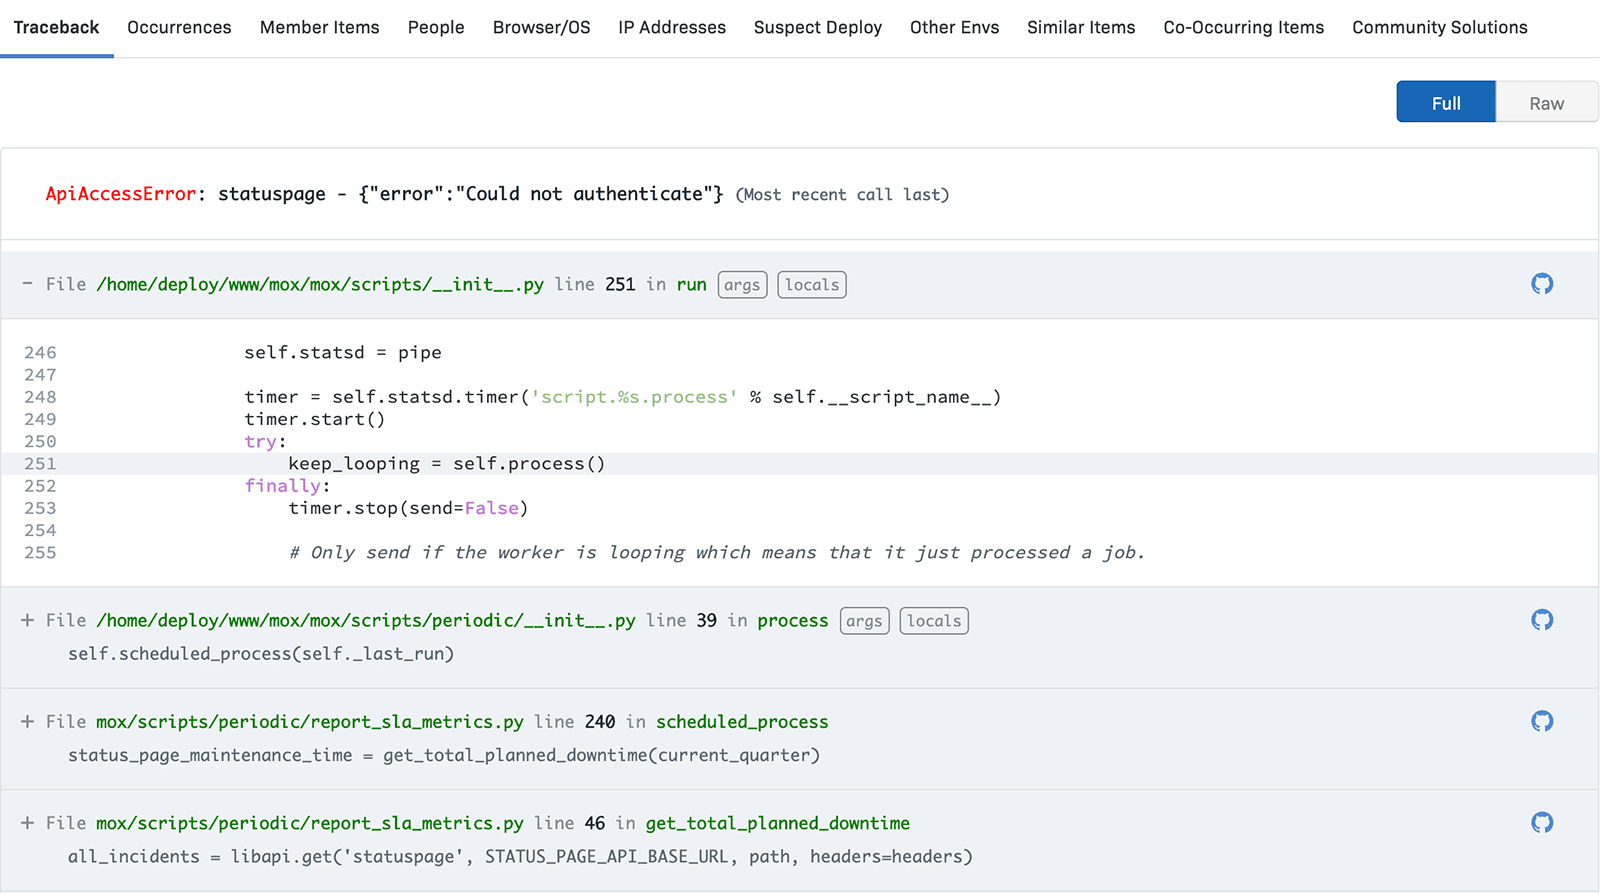
Now, as a software developer, you can count on Rollbar’s real-time error stream. It contains rich monitoring data you can look up on Rollbar when something goes wrong:
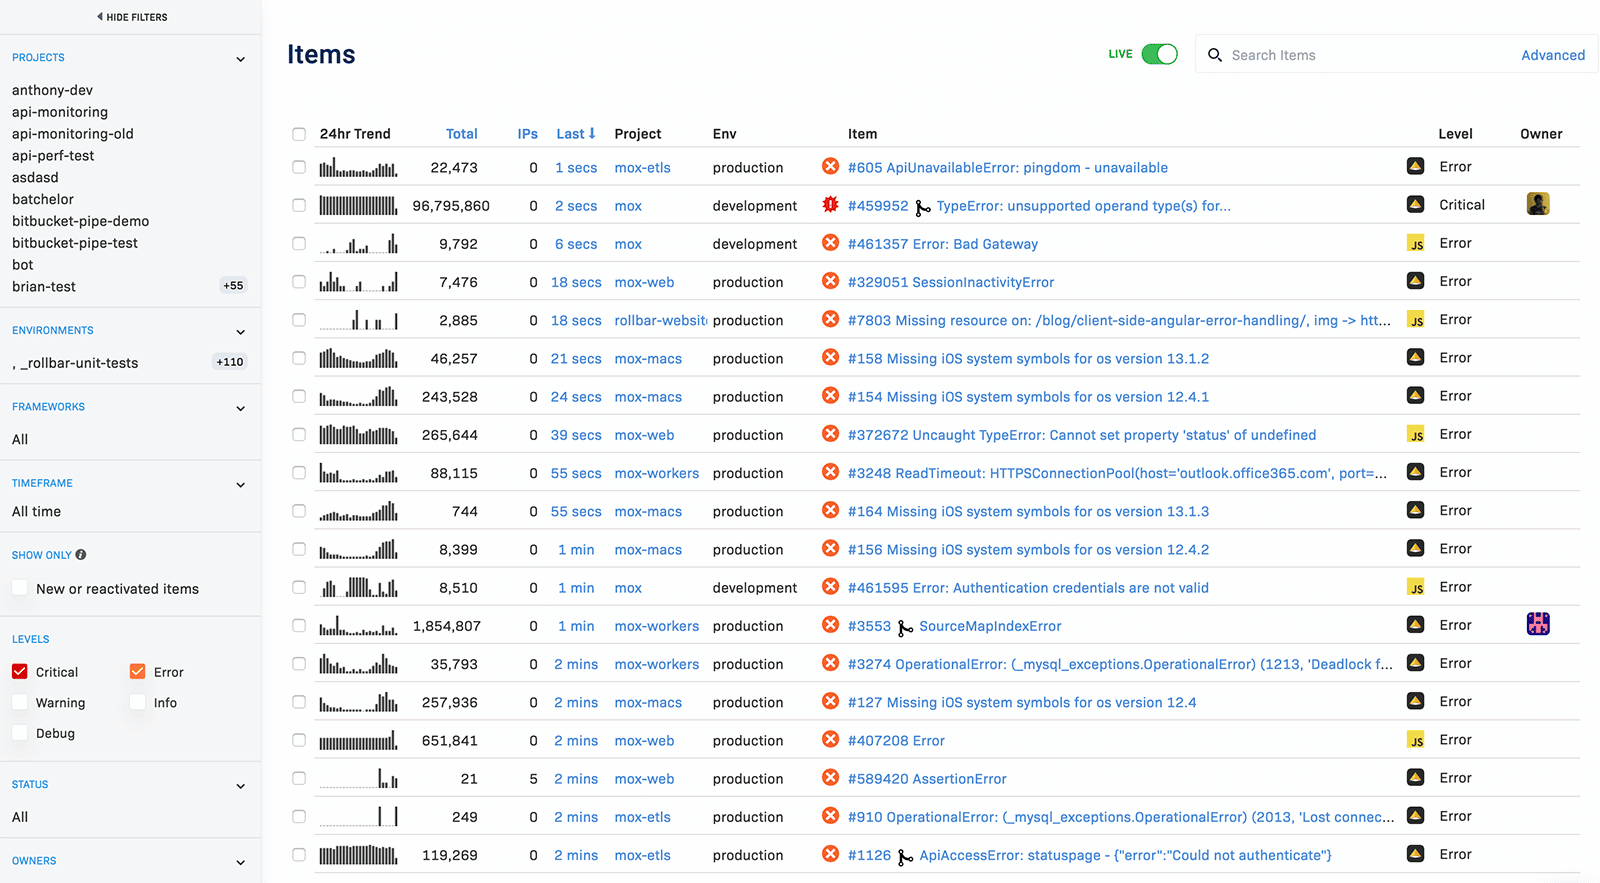
Rollbar locates errors and provides rich tracing information with deep links associated with your source code. It also allows you to instantly group and sort occurrences by different aspects, such as environment, category, priority, and owner.
By opening one of the report items, you can get a full stack trace that includes links to the underlying code components for each step in the call stack. Optionally, you can integrate Rollbar with your Git-based version control repositories including Bitbucket, GitHub, and GitLab. This integration connects any errors directly to your codebase to help you detect and fix errors faster.
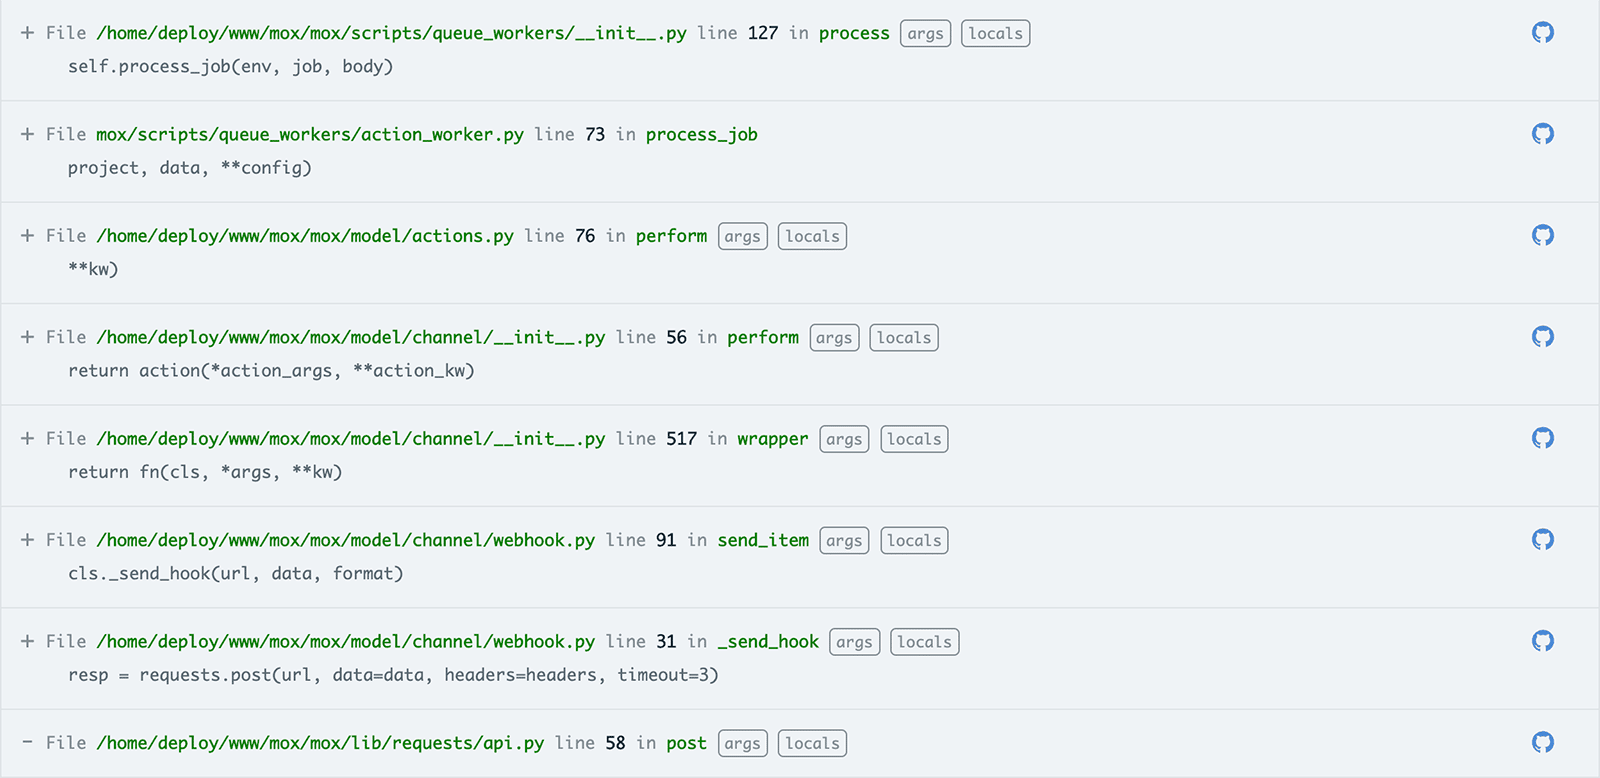
With a single click, you can go from the stack trace directly to the line of code causing the error.
Now, Kendall can combine the failed test plan information with these detailed reports from Rollbar to provide more helpful bug reports.
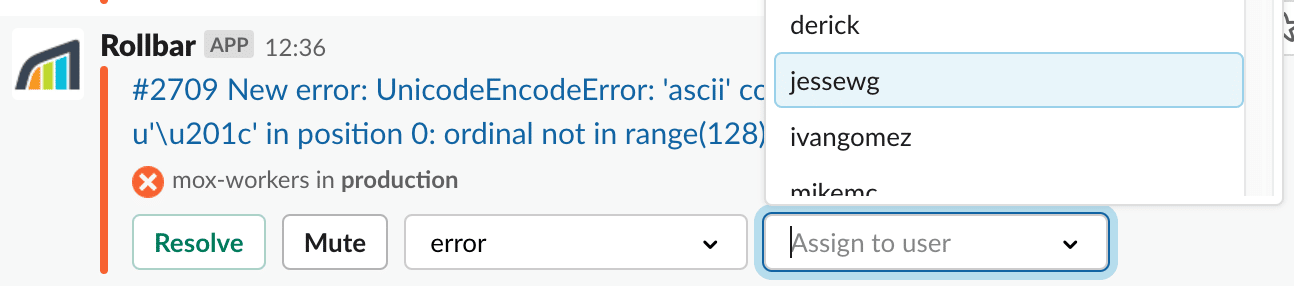
Additionally, you can configure real-time, customizable error alerts in collaborative tools such as Slack and PagerDuty. These alerts keep your team continuously informed of bugs and other occurrences in any development environments, even when nobody is monitoring Rollbar dashboard:
Next-Level QA
Error monitoring isn’t just for production. Monitoring bugs across the early stages of the development lifecycle is key to preventing software defects from leaking into the production environment. And so it helps if QA closely collaborates with development teams with the help of appropriate tooling and processes. With Rollbar, you get a real-time bug report — including unhandled exceptions — so you are aware of them as they happen.
Rollbar enables teams to spend less time worrying and more time on improving code, deploying more often and with confidence.
Give Rollbar a try today. It supports many platforms, and has a 14-day free trial.