Debugging can be a life-saver when it comes to discovering bugs or errors in your code. In this article you will learn how to debug using the C/C++ extension for VS Code, including advanced features like breakpoints, tracking variable values, and stepping.
The Code We’ll Debug
Throughout this tutorial, the following C++ class is used as an example (vector.h):
class Vector {
    private:
        float start_y;
        float start_x;
        float end_y;
        float end_x;

    public:
        Vector() {
            start_x = -1;
            start_y = -1;
            end_y = -1;
            end_x = -1;
        }

        Vector(float start_a, float start_b, float end_a, float end_b) {
            start_x = start_a;
            start_y = start_b;
            end_y = end_a;
            end_x = end_b;
        }

        float get_length() {
            return sqrt((end_x - start_x) * (end_x - start_x) + (end_y - start_y) * (end_y - start_y));

      }
};
This class is being called by the following main function (pathfinder.cpp):
#include <math.h>
#include <iostream>
#include “Vector.h”

int main() {
    std::cout << "Hello World \n";

    Vector myVector(1, 2.6, 3.1, 4.5);
    Vector myVector2(10, 2.6, 3.1, 4.5);

    std::cout << myVector.get_length();

    return getchar();
}
How to Setup C++ Error Debugging in VS Code
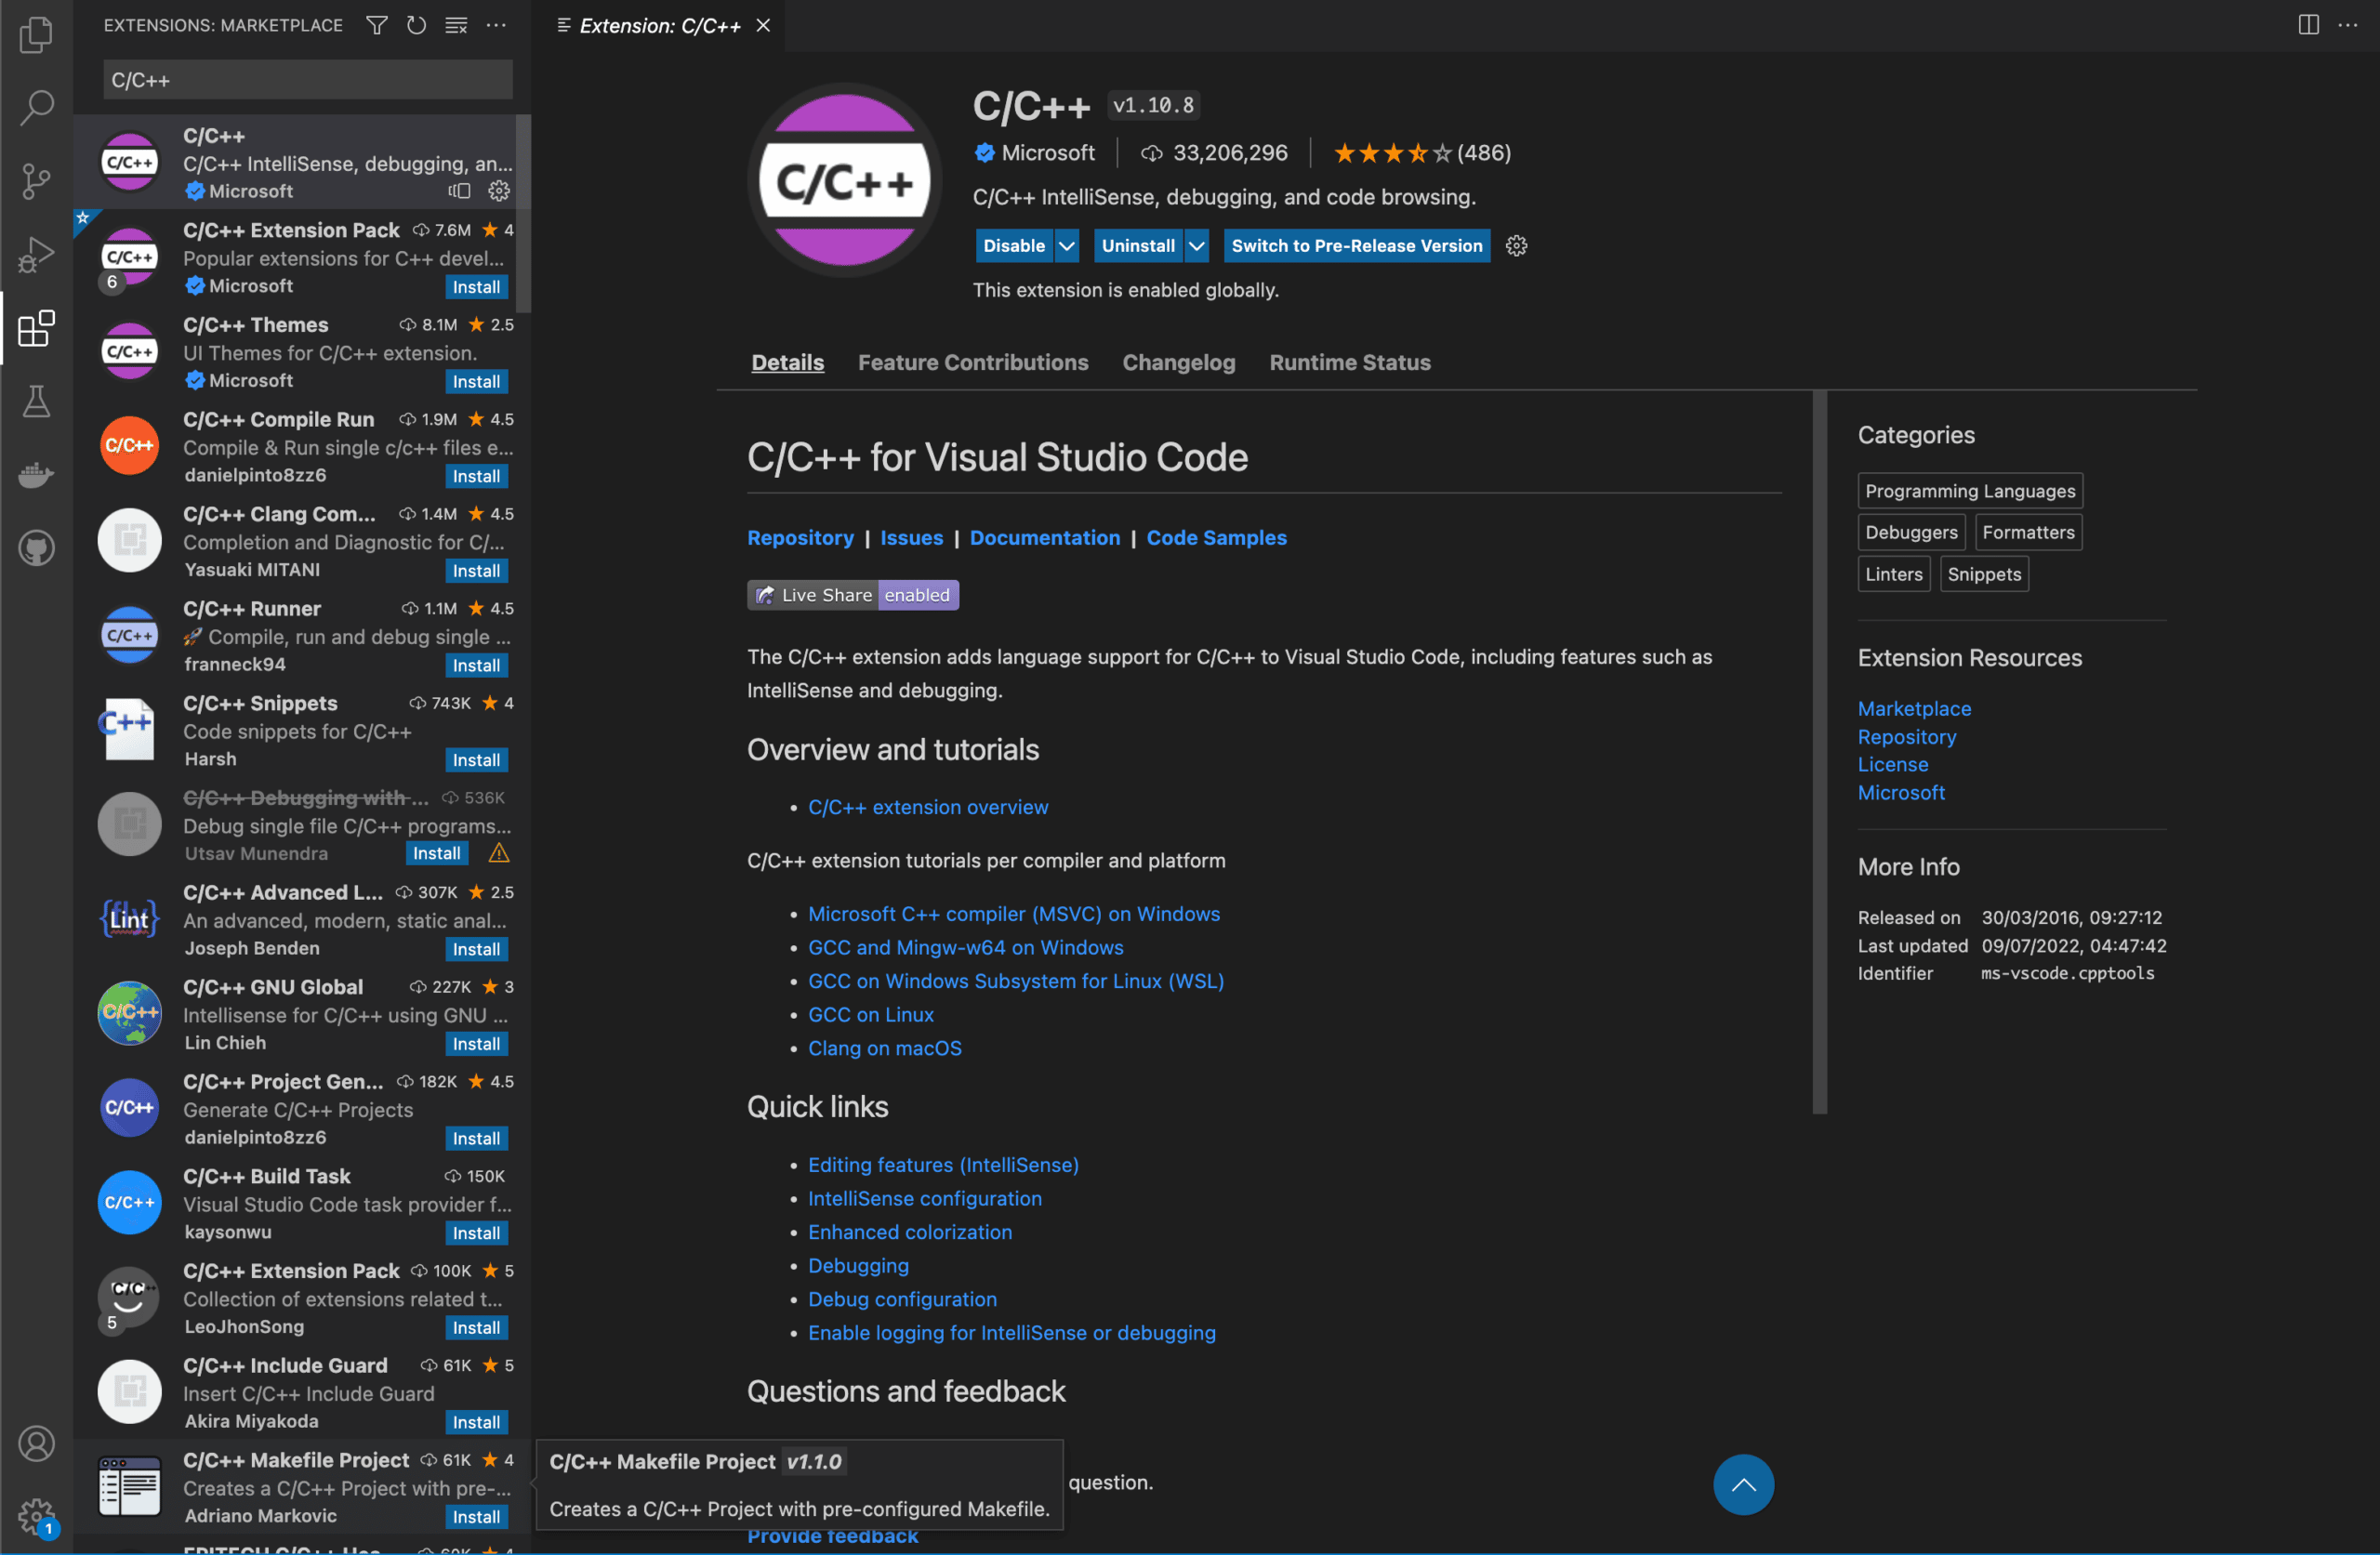
Visual Studio Code (VS Code) is a source code editor by Microsoft that supports debugging. VS Code does not come prepackaged with a C++ debugger, however, so one needs to be added. VS Code will normally prompt the user to add the C/C++ support extension when starting a new C++ project. However, if this prompt is missed or doesn't appear, the extension can be found by selecting extensions on the left toolbar and searching for "C/C++". The project may need to be reloaded after doing so to ensure the extension is enabled.
Once an application has been created, select the “Run and Debug” icon on the left toolbar to initialize debug mode.
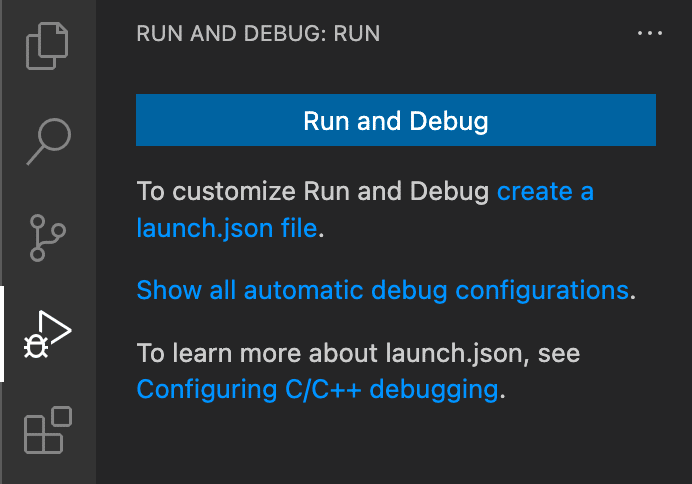
You will be prompted to create a launch.json file. This file will hold configurations that instruct the debugger how to operate.
Once the launch.json file is created, select “Add Configuration” to view a list of configurations associated with the C++ compiler (or compilers) installed on the device.
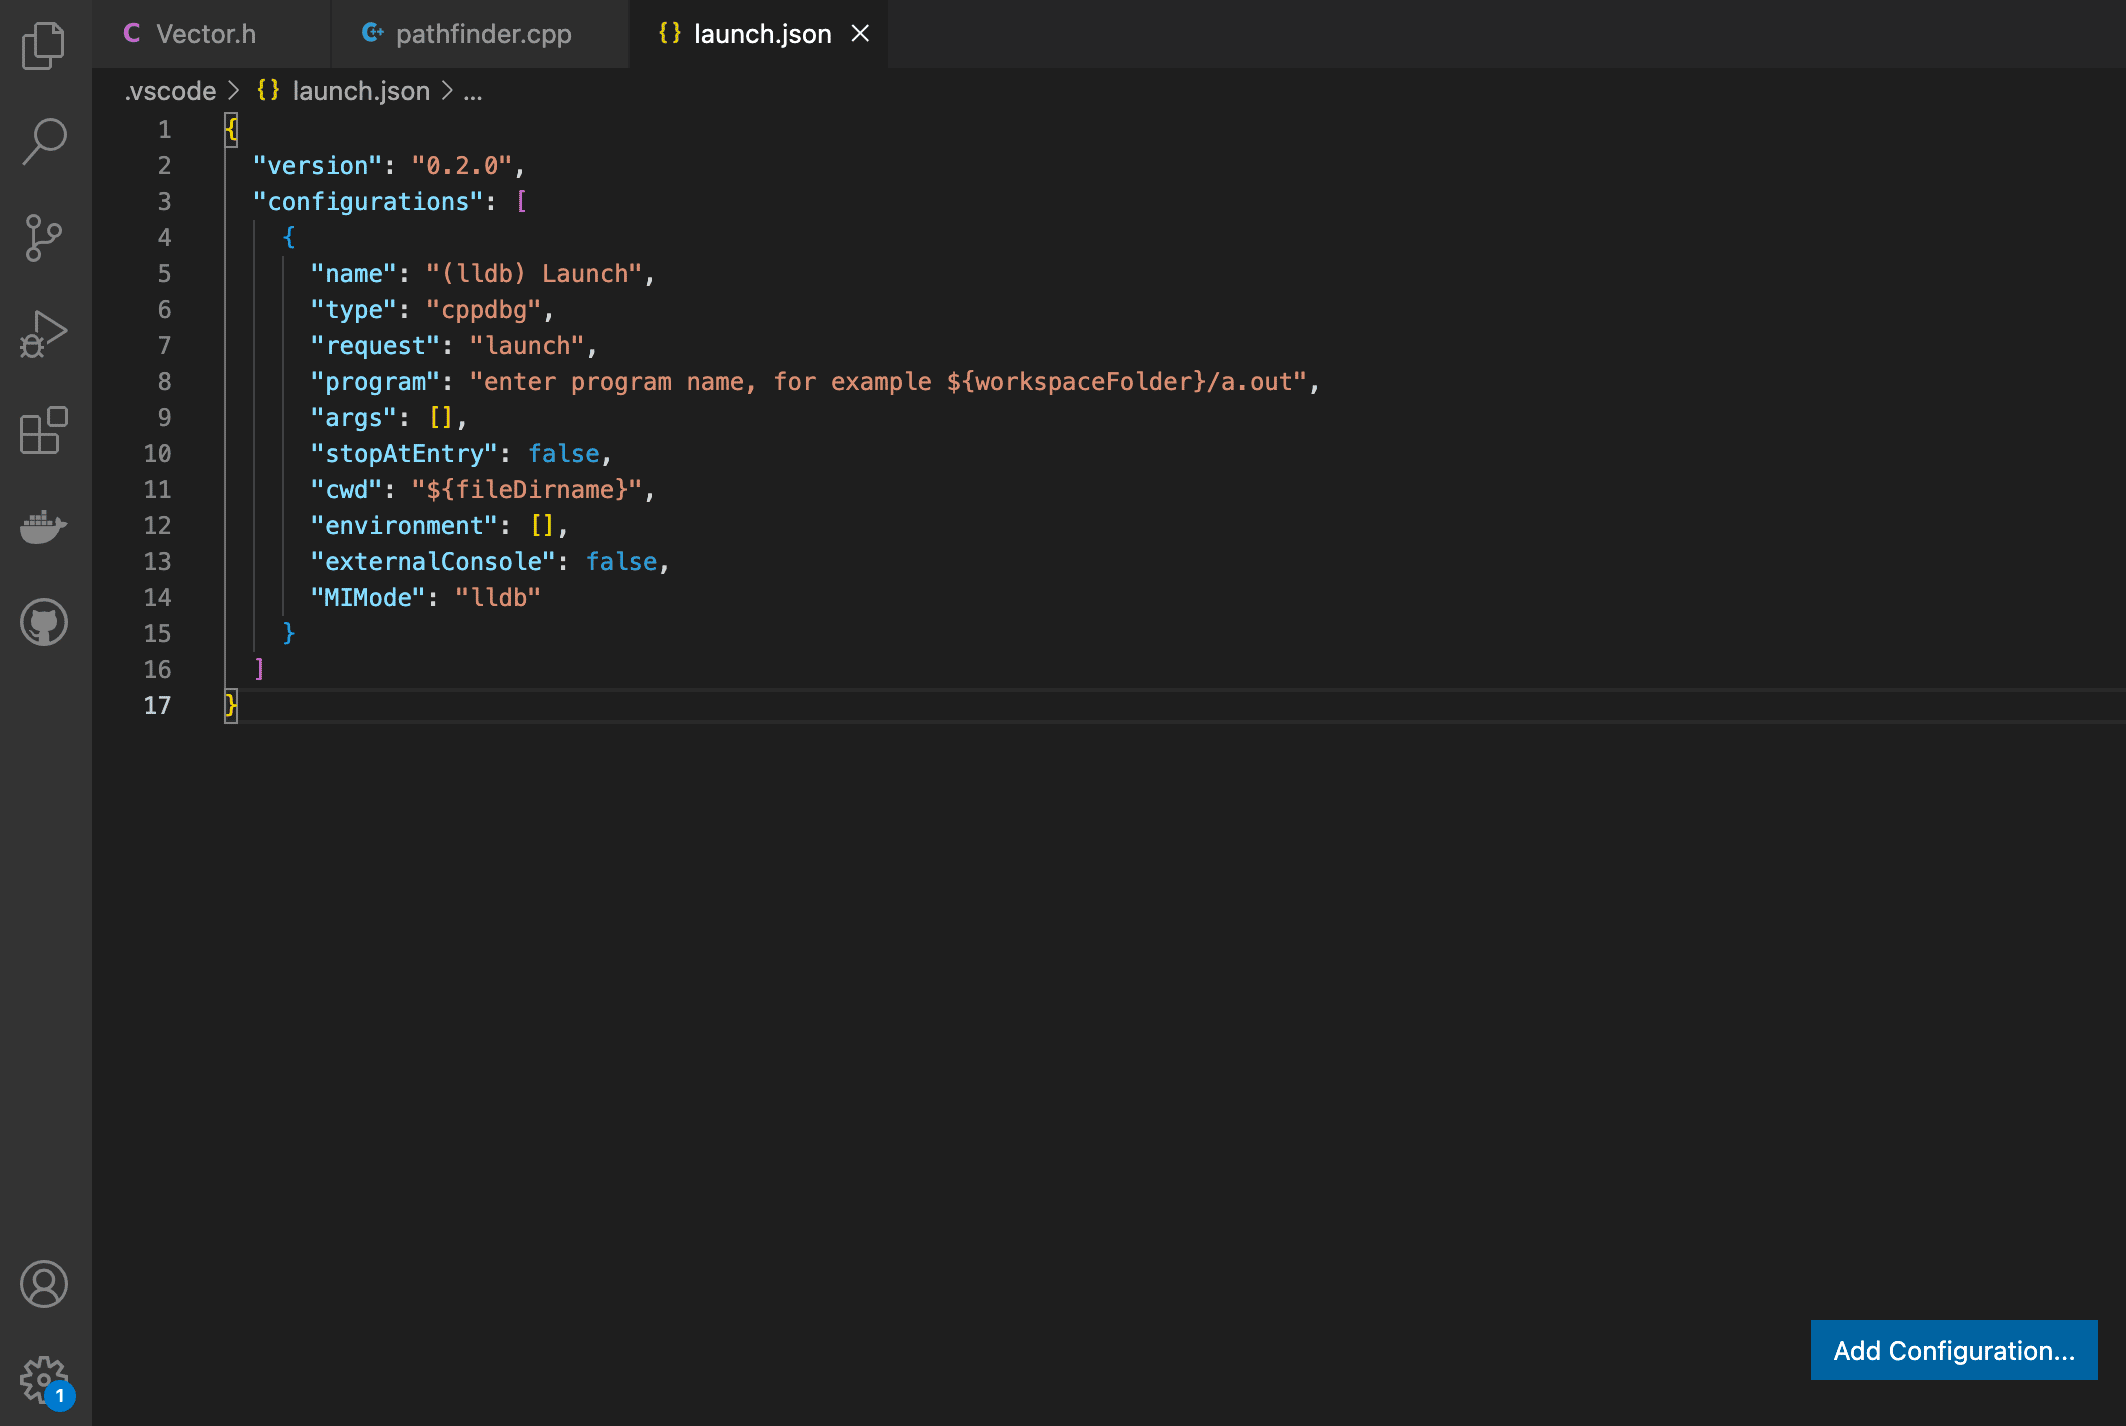
Selecting a configuration will auto-fill in the .json file. The settings can be left as they are except for the “program” field, which must be modified to point to the program executable.
{
    // Use IntelliSense to learn about possible attributes.
    // Hover to view descriptions of existing attributes.
    // For more information, visit: https://go.microsoft.com/fwlink/?linkid=830387
    "version": "0.2.0",
    "configurations": [
        {
            "name": "(macOS lldb) Launch",
            "type": "cppdbg",
            "request": "launch",
            "program": "${workspaceFolder}/Debug/pathfinder.exe",
            "args": [],
            "stopAtEntry": false,
            "cwd": "${fileDirname}",
            "environment": [],
            "externalConsole": false,
            "MIMode": "lldb"
        }
    ]
}
launch.json Configuration File: Note “program” variable must be modified to point towards your programs executable (.exe file)
Finally, compile the program using the desired compiler. With the program compiled, you will be able to select "Run and Debug" from the Debug menu to launch the debugger.
General Steps for C++ Error Debugging
1. Recognize that an error exists
Bugs and errors can come in all shapes and sizes. Some, like a program crashing during startup, are immediately obvious, while others are more subtle. Typically, thorough testing is necessary to find all problems within an application.
2. Isolate the error
Isolating the error means narrowing down the source of the error as much as possible. If there is a specific method or function where the error is occurring, it should be run by itself to save time and complexity.
3. Identify the cause of the error
By using breakpoints and stepping, we move slowly through the code and monitor the values stored in memory, the call stack, and other execution details to identify the exact cause of the error.
4. Rectify the issue in the code
Once the source of the error is known, the code must be modified to correct it. This will be specific to the exact error cause.
Specific Steps for Debugging a C++ Application in VS Code
1. Setting Breakpoints
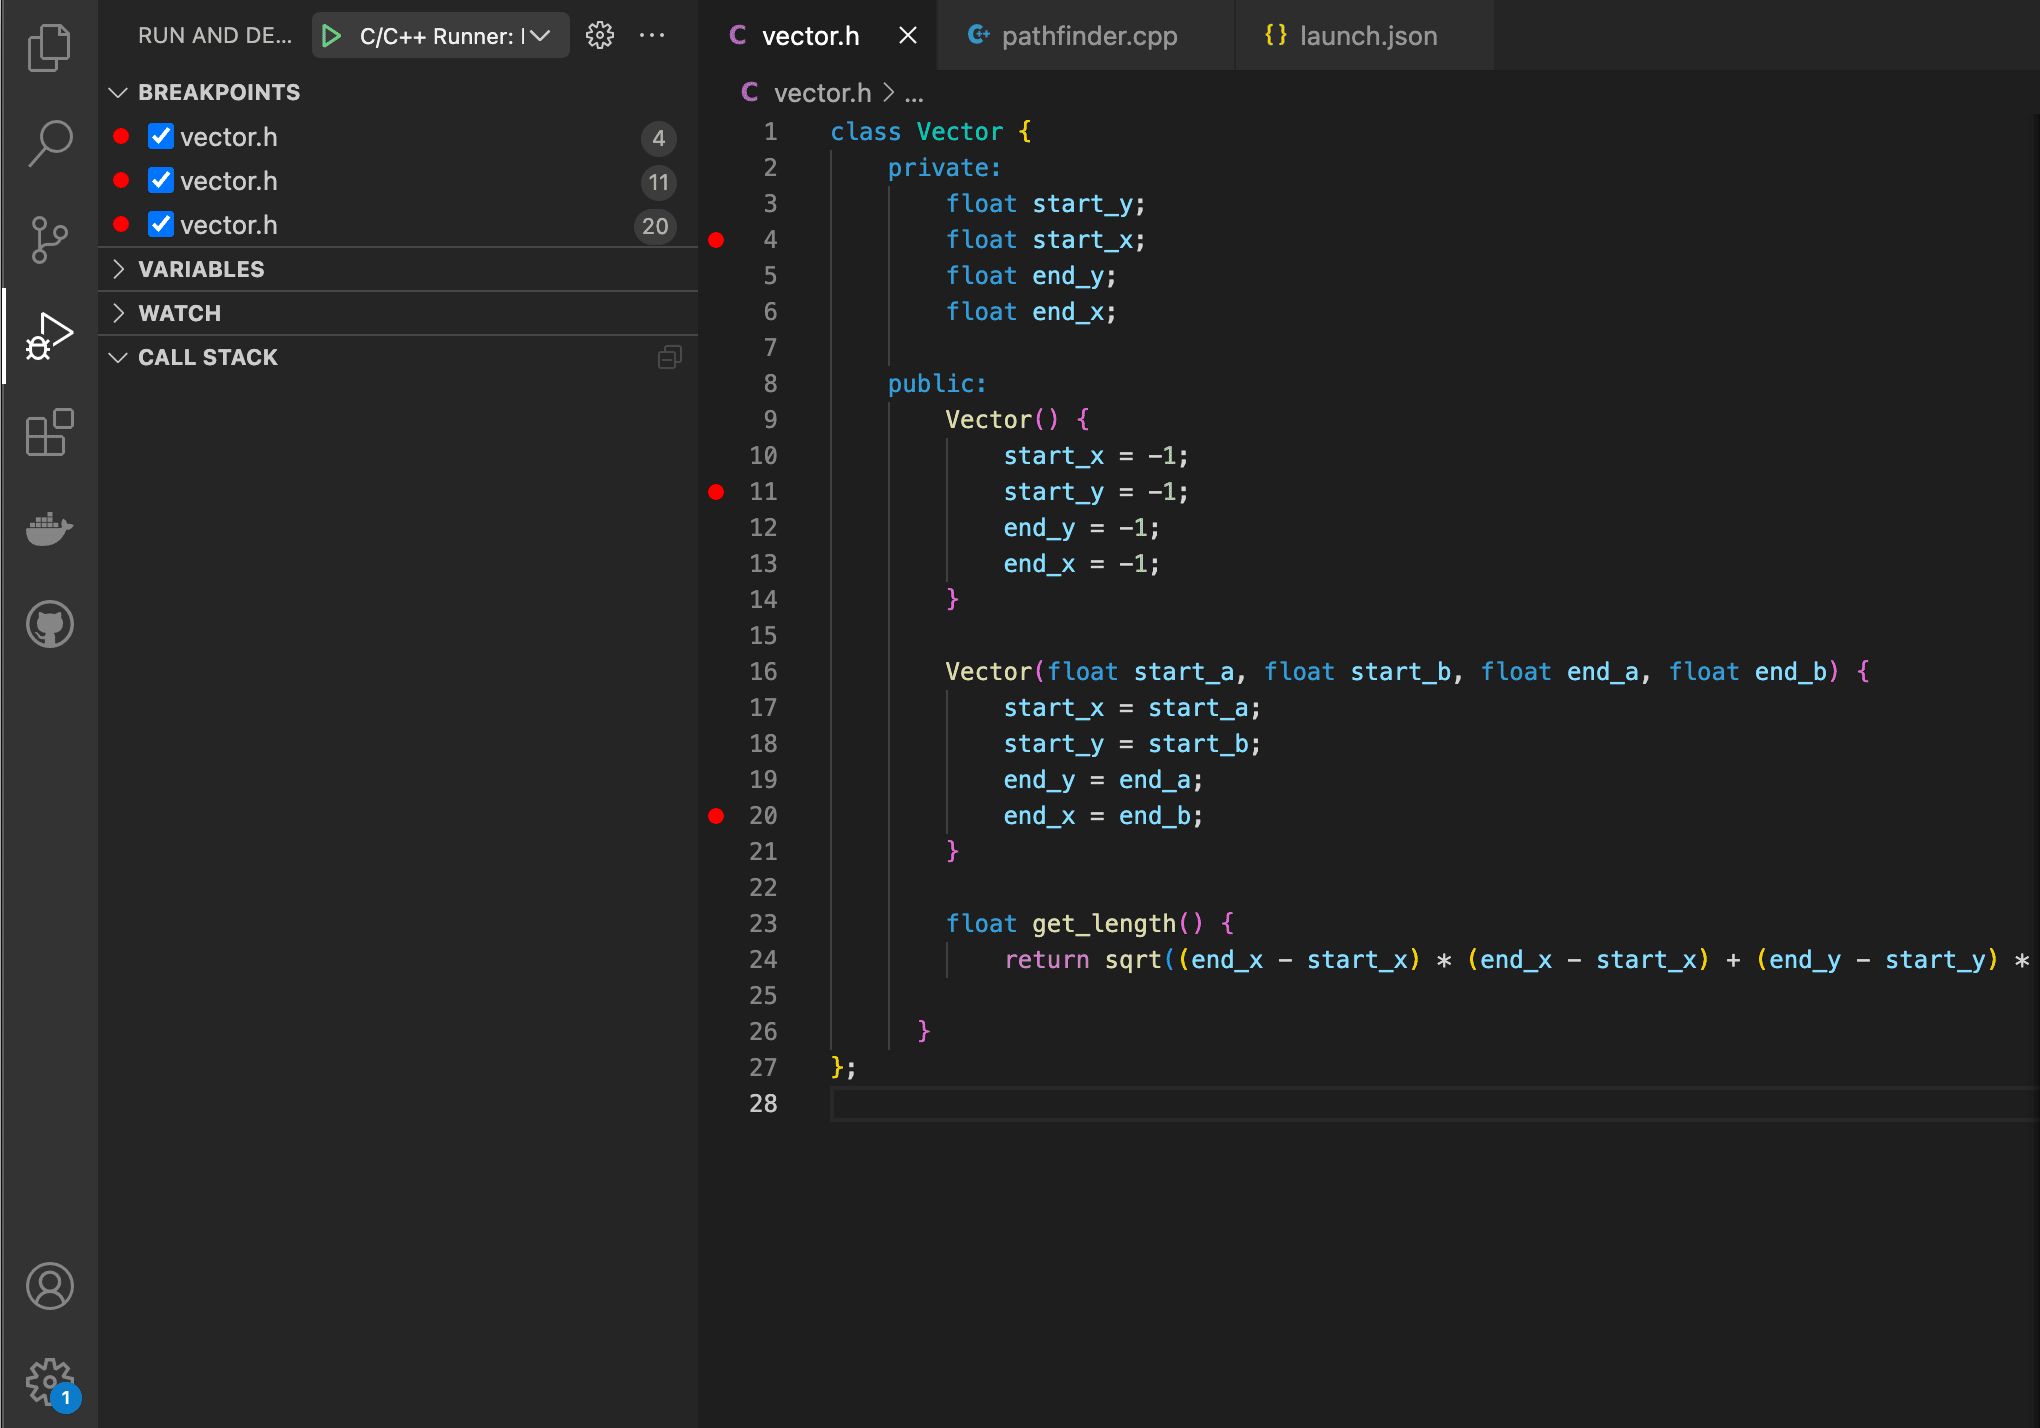
Breakpoints are used to pause the flow of your program at a specific point. This allows you to view the details of execution at that point in the program flow. A breakpoint can be added in VS Code either by clicking in the left column of the text editor window or by pressing F9. A breakpoint will appear as a red circle in the left column of the text editor. A list of all breakpoints is also shown in the debugger window when debug mode is active.
2. Conditional and Unconditional breakpoints
By default, a breakpoint is unconditional, meaning the breakpoint will pause execution each time the program flow reaches that line. If, however, you need execution to pause only when certain conditions are met, conditional breakpoints can be used.
To add a conditional breakpoint, right-click the left column of the text editor and select "Add Conditional Breakpoint". At this point, you will be able to select from "Expression", which pauses execution when an expression returns true, "Hit Count", which will break when a certain hit count is reached, or "Log Message," which prints a message to the log. In each of these instances, a new line will be added beside the breakpoint where you can enter the details of the condition.

3. Inline breakpoints
Inline breakpoints (added with shift+F9) allow you to set multiple breakpoints in a single line of code. This can be useful when multiple conditional breakpoints are needed or when multiple statements are nested in the same line.
4. Function breakpoints
Function breakpoints are created by selecting the + sign in the breakpoints section of the debug menu and typing in the function name. This can be very useful if you are calling functions from a source file that is not available.

5. Data breakpoints
When supported data breakpoints are added from the variable view in the debug menu, these breakpoints will be triggered when the value of the selected variable changes during execution.
6. Starting the program in debug mode
Once configurations and breakpoints have been set up, the debugging process can be started. To run the program in debug mode, press the play button at the top of the debug menu.
7. Tracking variable values
While the program is running, information is displayed in the debug menu on the left side of the screen. Of this information, the variables drop down, which is often the most valuable. Selecting this drop down will show the values of all variables currently initialized as well as the registers being used during execution and the values stored in them.
8. Utilize Stepping
Once the program is running in debug mode, a set of buttons will appear at the top of your screen. These buttons control the execution of the program. The pause/play toggle will start the program running and continue until the next breakpoint is reached. Step Over and Step Into move one instruction at a time and manage how function calls are dealt with. Step Over will skip over any function calls or methods, while Step Into will follow those calls. The fourth option is Step Out, which will execute all commands within its current function or method and break when returning to the calling function. The last two are Restart and Stop, which are self-explanatory.

Track, Analyze and Manage Errors With Rollbar
Managing errors and exceptions in your code is challenging. It can make deploying production code an unnerving experience. Being able to track, analyse, and manage errors in real-time can help you proceed with more confidence. Rollbar automates error monitoring and triaging, making fixing C++ errors easier than ever. Sign Up Today!


