
A memory leak is a situation where unused objects occupy unnecessary space in memory. Unused objects are typically removed by the Java Garbage Collector (GC) but in cases where objects are still being referenced, they are not eligible to be removed. As a result, these unused objects are unnecessarily maintained in memory.
Memory leaks block access to resources and cause an application to consume more memory over time, leading to degrading system performance. If memory leaks are not handled, an application can eventually run out of memory and terminate with an 'OutOfMemoryError', which is irrecoverable.
What Causes Memory Leaks in Java
In general, a Java memory leak happens when an application unintentionally (due to logical errors in code) holds on to object references that are no longer required. These unintentional object references prevent the built-in Java garbage collection mechanism from freeing up the memory consumed by these objects.
Common causes for these memory leaks are:
- Excessive session objects
- Insertion without deletion into Collection objects
- Unbounded caches
- Excessive operating system page swapping
- Un-invoked listener methods
- Poorly written custom data structures
Types of Memory Leaks in Java
Memory leaks can be of various types, depending on how they happen. The most common types are detailed below:
1. Through static Fields
Excessive usage of static fields can potentially lead to a memory leak. In Java, static fields usually remain in memory as long as the application is running. Here’s an example:
public class StaticFieldsMemoryLeakExample {
    private static List<Integer> integers = new ArrayList<Integer>();

    public void insertIntegers() {
        for (int i = 0; i < 100000000; i++) {
            integers.add(i);
        }
    }

    public static void main(String[] args) {
        new StaticFieldsMemoryLeakExample().insertIntegers();
    }
}
In the above example, the addIntegers() method populates a static List object, which remains in memory throughout the program. The memory usage can be seen in the Java VisualVM monitor below:
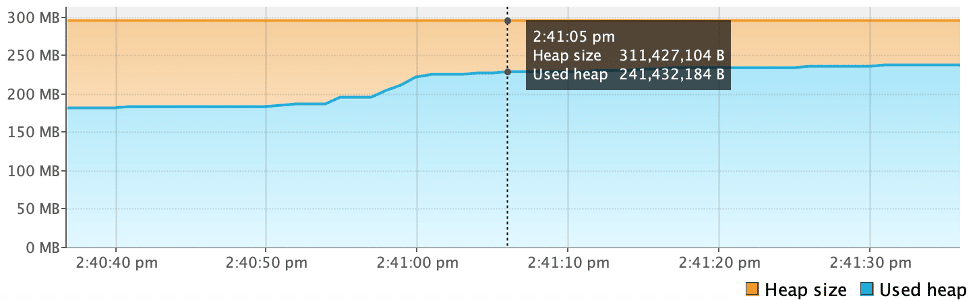
As expected, the memory consumed by the List object was not garbage collected and remains in memory.
To prevent these types of memory leaks, the usage of static fields should be minimized, especially when using large objects such as collections. Also, when using singletons, the lazy loading design pattern can be used so that resources are only initialized when they are needed.
2. Unclosed Resources
Resources such as connections and streams utilize memory. If they are not closed, memory allocated to these resources is blocked and the GC is unable to free up this space. Here's an example:
public void readFromURL() {
try {
URL url = new URL("http://example.com");
URLConnection urlConnection = url.openConnection();
InputStream is = urlConnection.getInputStream();
byte[] bytes = is.readAllBytes();
} catch (IOException ioe) {
ioe.printStackTrace();
}
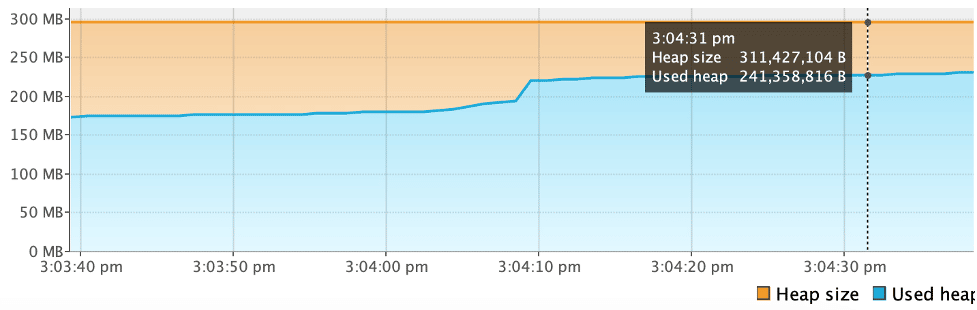
}In the above example, the readFromURL() method opens a URL connection object but does not close it. Since the object is referenced even after it is no longer used, it continues to block memory and is not eligible for garbage collection. This can be seen in the VisualVM monitor below:
To prevent these types of memory leaks, the finally block should be used to close resources when they are no longer needed. From Java 8 onwards, the try-with-resources block can also be used to automatically close resources. The code to close resources should not itself throw any exceptions.
3. Improper equals() and hashCode() Implementations
Not writing proper overriding implementations for equals() and hashcode() methods when creating a new class can potentially lead to memory leaks in Java. Particularly the HashSet and HashMap classes use these methods for many operations, and it is best to carefully write correct implementations of these methods. Here's an example of a new class without equals() and hashcode() implementations:
public class Foo {
public int id;

        public Foo(int id) {
                this.id = id;
    }
}
If the above class is used as a key for a HashMap or HashSet, duplicate entries can potentially be added since there is no way to determine how two objects should be considered equal:
public void populateMap() {
Map<Foo, Integer> map = new HashMap<Foo, Integer>();
for(int i = 0; i < 10000; i++) {
map.put(new Foo(1), 1);
}
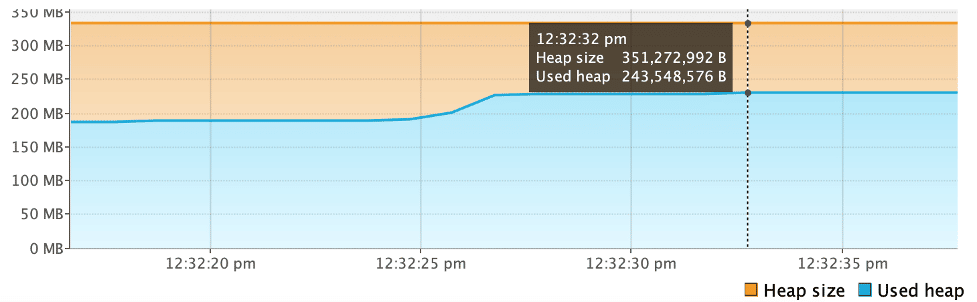
}In the above method, the map object will contain 10000 entries for the same Foo key object, which should only have been inserted once, since Map does not allow duplicate keys. These duplicate objects add up, block memory and are ineligible for garbage collection. This can be seen in the VisualVM monitor below:
As a prevention, when writing new classes, equals() and hashCode() methods should be overridden. Optimally implementing these methods will help with proper utilization of resources and memory.
How to detect a memory leak in Java
Detecting memory leaks requires using a combination of various tools and techniques. Some of the most common and effective ways are:
1. Using Memory Profilers
Memory profilers are tools that can monitor memory usage and help detect memory leaks in an application. Profilers can also help with analyzing how resources are allocated within an application, for example how much memory and CPU time is being used by each method. This can help identify and narrow down any issues.
There are several tools that can be used for memory profiling in Java. Some of the most commonly used ones are - Java VisualVM, JProfiler and YourKit. Java VisualVM was used in this article to help display memory usage in the memory leak examples and illustrate how memory can be monitored using a profiler.
2. Verbose Garbage Collection
To obtain a detailed trace of the Java GC, verbose garbage collection can be enabled. The following parameter can be added to the JVM configuration to enable verbose garbage collection:
-verbose:gcThe default error output shows the summary, which can help understand how memory is managed and identify any memory leaks.
3. Using Heap Dumps
Heap dumps provide a snapshot of heap memory of a Java application at a particular time. They provide information on how many object instances are open and how much memory they consume. Heap dumps can help with analyzing how many objects are created in an application and if any of them are potentially causing any memory leaks.
Track, Analyze and Manage Java Errors With Rollbar
Managing errors and exceptions in your code is challenging. It can make deploying production code an unnerving experience. Being able to track, analyze, and manage Java errors in real-time can help you to proceed with more confidence. Rollbar automates error monitoring and triaging, making fixing errors easier than ever. Try it today!