It’s pretty well known that every web app needs frontend JavaScript these days to provide the best possible user experience. You are probably going to have a bunch of JavaScript files that need to be loaded by your users for that to happen, and since we all care about performance, minifiying and compressing these files is an absolute must.
But what happens when it comes time to debug issues in these minified files? Stack traces will more or less be completely useless. How do we solve this problem?
JavaScript source maps solve this problem. They allow you to map a point in a minified file back to the unminfied source, making it possible to actually identify and fix issues encountered in a production app environment.
Below I have outlined a simple guide for setting up source map generation and usage in a sample Django app. You’ll learn how generate source maps for minified files, debug errors that happen in these files, and also a quick overview of what’s required to get this working for your production environments.
Local Debugging with Source Maps
Say you have a simple Django app with the following directory structure:
...
app/
    ...
    views.py
    static/
        js/
            site.js (containing various models and functionality used in your app)
            jquery.js (unminified)
            util.js
    templates/
        index.html
site.js would have the following code:
var aFunction = function() {
    var a = b;
}

App = {};
App.errorCausingFunction = function() {
    aFunction();
}
views.py would just contain one view that rendered index.html, and here is how index.html would look like:
...
<script type="text/javascript" src="static/js/site.js"></script>
<script type="text/javascript" src="static/js/jquery.js"></script>
<script type="text/javascript" src="static/js/util.js"></script>
....
<script type="text/javascript">// <![CDATA[
App.errorCausingFunction();
// ]]></script>
...
Let’s minify. Start by installing UglifyJS2:
npm install -g uglify-jsHere is an example command run from app/ that will generate minified Javascript:
uglifyjs static/js/site.js static/js/jquery.js static/js/util.js --output static/js/all.min.jsHere we are using uglifyjs to minify three JS files, site.js, util.js, and jquery.js, into all.min.js.
Update your index.html to include only all.min.js:
Now let’s try navigating to index.html and seeing what happens:
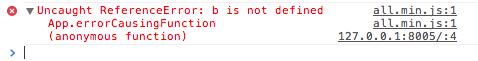
Not the most helpful stack trace. All the line numbers are 1, and if this were a much larger file with more generic function/variable names, it would be completely useless in helping you debug where things went wrong.
Let’s introduce source map functionality to our app.
Modify your minification command to look like this:
uglifyjs static/js/site.js static/js/jquery.js static/js/util.js --output static/js/all.min.js --source-map static/js/all.min.map --source-map-url /static/js/all.min.mapHere we are adding two new options, --source-map and --source-map-url. UglifyJS2 will now generate the resulting source map as static/js/all.min.map, and will append a comment to the end of
the minified file containing the url to the source map on your website, in this case /static/js/all.min.map. Note, you may need to modify the comment in all.min.map to read //# instead of //@, as this is a recently new convention.
Now navigate to your app in Chrome with Developer Tools open. If everything is set up right, Chrome will automatically translate the frames in the stack trace to the unminified equivalents, like so:
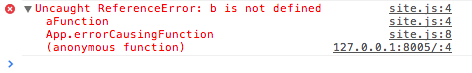
Note that the filenames and line numbers now refer to the original source code, instead of the minified source.
Production Debugging with Source Maps
The above process is all fine and dandy for errors encountered on your local machine, but what if you want to keep track of errors encountered by your users in real-time?
Here at Rollbar, we have recently reworked our error processing pipeline to support the application of source maps on JavaScript errors. Here’s how you would get Rollbar hooked up and reporting from your production environment:
-
Create a Rollbar account
-
Follow the instructions to insert the Rollbar Javascript notifier snippet into your base template
-
Modify the snippet configuration to signal that source maps should be used:
js _rollbarParams = { // ... other params ... // set this to 'true' to enable source map processing "client.javascript.source_map_enabled": true, // provide the current code version, i.e. the git SHA of your javascript code. "client.javascript.code_version": "bdd2b9241f791fc9f134fb3244b40d452d2d7e35" } -
Make sure your minified files link properly to publicly accessible source maps using the
sourceMappingURLcomment:// ... minified js file contents ... //# sourceMappingURL=
Now, when your app sends Rollbar an error report, Rollbar will automatically attempt to download source maps defined in your minified files and apply them to stack frames located in these files.
Automating things
It’s a bit annoying to have to minify everything every time you change one of your Javascript files. We have a small script set up here in our dev environments that uses macfsevents to listen for Javascript file changes. Once such events occur, we check to see if only the Javascript files we care about are affected. If so, we run an uglifyjs command on all the Javascript files to generate minified sources and source maps.
You can even go one step further by making an API call to Rollbar to upload your source map as part of your deploy process. This API endpoint also accepts source file uploads for files referenced by the source map, giving us the ability to print out the unminified source code for each frame in the stack trace. For example:
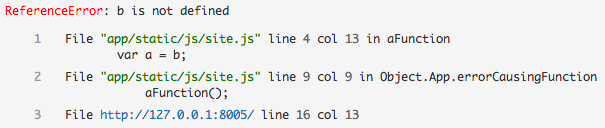
Here’s a sample command you could use to upload a source map and source file to our API:
curl https://api.rollbar.com/api/1/sourcemap \
-F access_token=aaaabbbbccccddddeeeeffff00001111 \
-F version=bdd2b9241f791fc9f134fb3244b40d452d2d7e35 \
-F minified_url=http://127.0.0.1:8005/static/js/all.min.js \
-F source_map=@app/static/js/all.min.map \
-F app/static/js/site.js=@app/static/js/site.js
The last param is a mapping of source file path to actual source file contents. The path would need to match the one defined in your source map, generated by your minification tool.
More info
Check out the documentation for more info about integrating your JavaScript and source maps with Rollbar. Rollbar also integrates with your Python, Rails, PHP and Node.js based backends.
If you haven’t already, signup for a 14-day free trial of Rollbar and let us help you defeat annoying django errors in your applications. 🙂