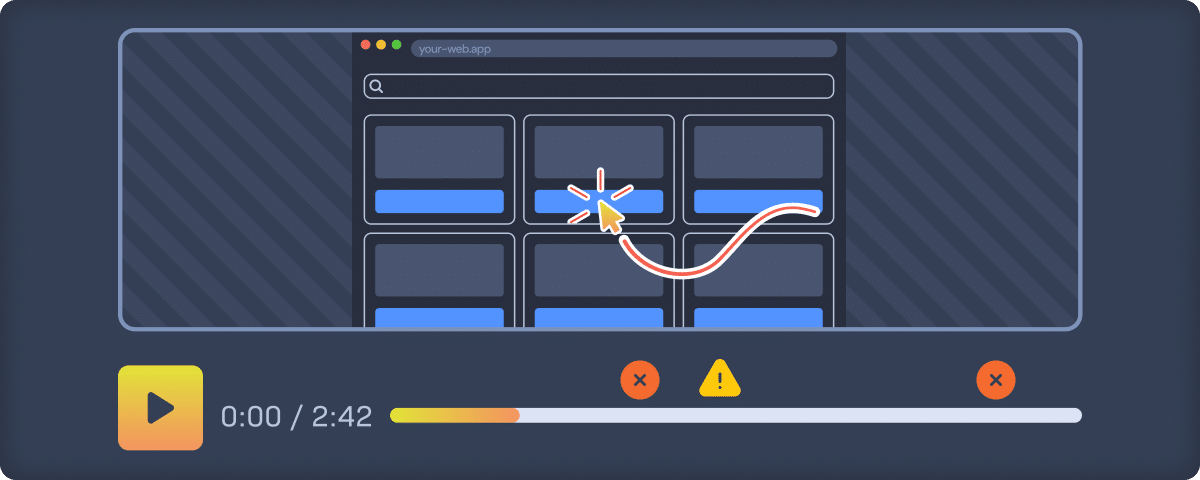
Debugging JavaScript errors just got easier. Today, we're launching Session Replay for Rollbar, giving you visual context for every error with customizable triggers and the only open-source MCP integration that lets AI analyze your sessions directly in your IDE.
The Missing Context
You get an error notification. The stack trace shows what broke, but you're left guessing how it happened. Was the user on mobile? Did they click something in the wrong order? Were they rushing through a flow? Without that context, reproducing the issue takes hours of back-and-forth with users or blind trial and error.
We built Session Replay because you told us you needed to see the user journey that led to each error. After months of beta testing with teams shipping JavaScript applications, we're ready to help you debug faster.
How It Works
When your JavaScript SDK detects an error, we automatically capture the user's session leading up to that moment. The replay shows up right in your Rollbar Item, linked to the specific error occurrence. No separate tool to learn, no extra dashboard to check.
Error-Linked Sessions
Every replay connects directly to an error in your dashboard. Click on any error and watch what the user was doing when it happened. Page loads, clicks, form inputs, navigation, everything that led to the problem.
Flexible Error Triggers
Unlike other session replay tools, we let you customize exactly when sessions get captured. Set triggers by error level (critical, error, warning). Select the path or customer events, and then configure the number of seconds before and after the error occurrence to record. This means you capture the right amount of context without wasting storage on irrelevant sessions, allowing you to focus on what matters most to your debugging workflow.
Capturing All Sessions
For deeper investigation, you can now capture and view all user sessions, not just ones with errors. This helps when you need to understand user flows, investigate UX friction points, or debug edge cases that don't trigger exceptions.
AI-Powered Analysis
Our Replay data is connected directly to our open-source MCP. This means your AI assistant can access Session Replay data directly in your IDE or favorite agent, analyzing user behavior patterns alongside your code. Watch a session replay, then ask AI to write test cases that reproduce the exact user flow. Get AI-generated debugging insights based on real session data, console events, network calls, and logs. All without leaving your development environment.
Setup Takes Minutes
Update your JavaScript SDK, and session recording starts automatically when errors occur. We use the same access tokens you already have. Sessions follow your existing data retention and permission settings.
What You Get
Free accounts include 1000 session replays, so you can see how error-focused Session Replay changes your debugging workflow. Integrate today to unlock full session replay capacity with AI-powered analysis through our open-source MCP integration available to everyone.
Unlike standalone session replay tools, you get complete telemetry data linked to every session: console events, network calls, and logs automatically connected to user behavior. This means you understand the cause, write accurate tests, and validate fixes using real session data instead of guesswork.
The performance impact is minimal. We've designed Session Replay to add negligible overhead to your applications while capturing precisely the context you need for faster debugging.
Getting Started
Session Replay is available now for all Rollbar customers. If you're using our JavaScript SDK, enabling session replay takes a few minutes. New to Rollbar? Start with a free account and see how visual debugging changes your workflow.
Get started with Session Replay
Check out our documentation for setup instructions and configuration options. Questions? Reach out to our team.


