

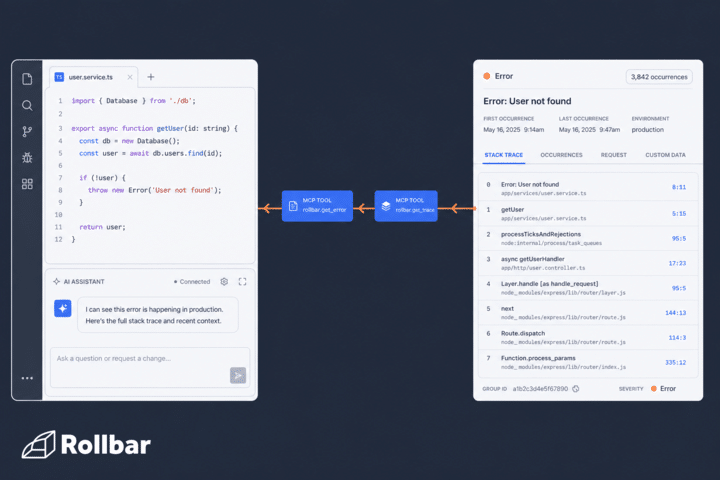
You’ve connected your AI coding assistant to your codebase, your docs, maybe even your internal wiki. It can autocomplete functions, explain unfamiliar code, and scaffold new features. But ask it what’s actually breaking in production right now, and it has nothing. No stack traces, no error trends, no idea which deploy introduced the regression your on-call just got paged for.
That’s the blind spot. Your AI assistant is working from code patterns alone, with zero visibility into what your application is doing once it ships. The Model Context Protocol (MCP) was built to close exactly this kind of gap, and most developers haven’t connected the one data source that would make their assistant genuinely useful for debugging: their error monitoring.
MCP servers give AI assistants live context. Most developers have only connected half of it.
If you’re using Cursor, Claude Desktop, Windsurf, VS Code with Copilot, or Continue, you’re already working with MCP-compatible clients. The Model Context Protocol is the open standard that lets these assistants pull structured context from external tools in real time, rather than relying on whatever’s in the prompt window.
The pattern is straightforward: you configure an MCP server, your client connects to it, and suddenly the assistant can query live data from that tool when it needs to reason about your code.
Most developers who’ve adopted MCP have connected the obvious sources: code repositories, documentation, maybe a project management tool. That gets the assistant further than raw code context alone. But it leaves a critical gap. The assistant still can’t see what’s happening in production. It can’t look up the error that just spiked, trace it back to a specific deploy, or pull the stack trace that tells you exactly where things went wrong.
That’s the piece Rollbar’s MCP server fills.
What Rollbar’s MCP server actually exposes to your assistant
Rollbar’s MCP server gives your AI coding assistant direct access to the production error data it needs to move from code-completion tool to debugging partner. Here’s what it can query:
Live error data and occurrence details. The assistant can retrieve active errors from your Rollbar project, including occurrence counts, severity levels, and affected environments. When you ask “what’s breaking in staging right now?”, it has an actual answer.
Full stack traces. Not a summary, not a guess from code patterns. The real stack trace from the real error, with file paths, line numbers, and frame context. This is the difference between the assistant suggesting a plausible fix and suggesting the right one.
Error item history and trends. The assistant can see when an error first appeared, how its frequency has changed, and whether it’s new or a regression. That context changes how you triage: a new error spiking after yesterday’s deploy gets a very different response than a long-tail issue that’s been stable for weeks.
Deployment context. Rollbar tracks deploys, so the assistant can correlate errors with specific releases. When it tells you an error started appearing after version 2.4.1 shipped, you’ve already narrowed your search to a single diff.
This isn’t a read-only summary. The assistant can query this data dynamically as part of your conversation, pulling exactly the error details it needs to reason about the code you’re working on.
What the debugging workflow looks like with MCP connected
Without Rollbar’s MCP server, the debugging workflow with an AI assistant looks like this: you get a page or a Slack notification, open Rollbar in your browser, find the error, copy the stack trace, paste it into your AI assistant, and ask for help. You’ve spent two minutes on context transfer before the assistant even starts reasoning.
With the MCP server connected, the workflow compresses. You ask your assistant: “What errors are spiking in production right now?” It queries Rollbar directly and comes back with the answer. You pick the one that matters, and the assistant already has the stack trace, the error history, and the deploy context. It can reason about the root cause with the same data you’d be looking at in the Rollbar dashboard, without you copying anything.
The shift is from “let me give you context” to “you already have the context.” That’s not a minor convenience. For teams doing multiple triage cycles a day, it’s a genuine workflow compression that keeps you in the editor instead of bouncing between tabs.
And because Rollbar tracks which deploy introduced an error, the assistant can narrow its suggestions to changes in the relevant release. Instead of reasoning about your entire codebase, it focuses on the diff that matters.
This works with any MCP-compatible client
Rollbar’s MCP server follows the open Model Context Protocol standard, which means it works with any client that supports MCP. That includes Cursor, Claude Desktop, Windsurf, Continue, and the growing list of editors and AI tools adopting the protocol.
You’re not locked into a specific IDE or a specific AI provider. If you switch from Cursor to Windsurf next month, your Rollbar MCP server setup carries over. The protocol is the contract, not the client.
Set it up this week
The setup is straightforward, and the Rollbar MCP server documentation walks through it step by step for each supported client. You’ll need your Rollbar project access token and a few minutes with your MCP client’s configuration file.
If you’re already using MCP servers for other tools, you know the pattern. Adding Rollbar follows the same shape: point the client at the server, provide credentials, and your assistant can start querying production error data immediately.
For teams that have already connected their code and documentation context via MCP, adding Rollbar is the highest-leverage next step. Your assistant can already read your code. Now it can see what that code is doing in production.
