Application Performance Monitoring (APM) tools are software platforms that help developers, DevOps engineers, and technical managers track the performance and health of their apps and infrastructure in real time. They collect telemetry data like response times, error rates, resource usage, and user behavior, visualize this data, and make it easier to detect performance issues, pinpoint root causes, and ensure a smooth user experience.
In short, they help teams be proactive rather than reactive.
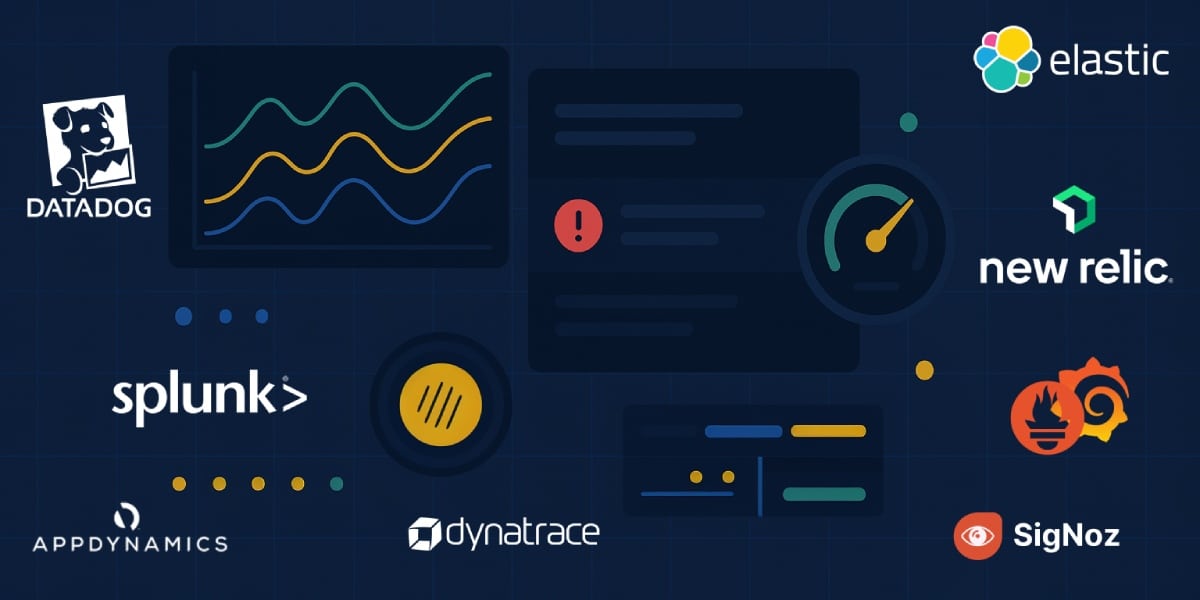
In this roundup, we’ll review eight of the best APM tools available today, covering a mix of SaaS platforms and open-source solutions. We’ll look at what makes each tool stand out, their pros and cons, who they’re ideal for, and how they’re priced (including free plans or trials where available). But first, let’s talk about how we evaluated these tools – in other words, what makes a great APM tool in the first place.
What Makes a Great APM Tool?
Not all monitoring tools are created equal. Here are some key criteria and features that distinguish a great APM tool from the rest of the pack:
- Comprehensive Monitoring: Full-stack visibility across application metrics, infrastructure health, and user experience
- User-Friendly Setup: Easy deployment with out-of-the-box instrumentation and intuitive interface
- Strong Integrations: Compatibility with your tech stack and other tools in your workflow
- Effective Alerting: Real-time monitoring with customizable alerts and root cause analysis
- Scalability: Ability to handle large systems without performance degradation
- Reliable Support: Strong community or vendor backing with regular updates
- Cost-Effective: Pricing model that provides good value and fits your budget
With these criteria in mind, let’s dive into the top APM tools that developers and DevOps teams should consider. For each tool, we’ll give a brief overview, highlight its pros and cons, note the ideal use cases, and summarize pricing (including free versions or trials where applicable).
The Top APM Tools of 2026
1. Datadog
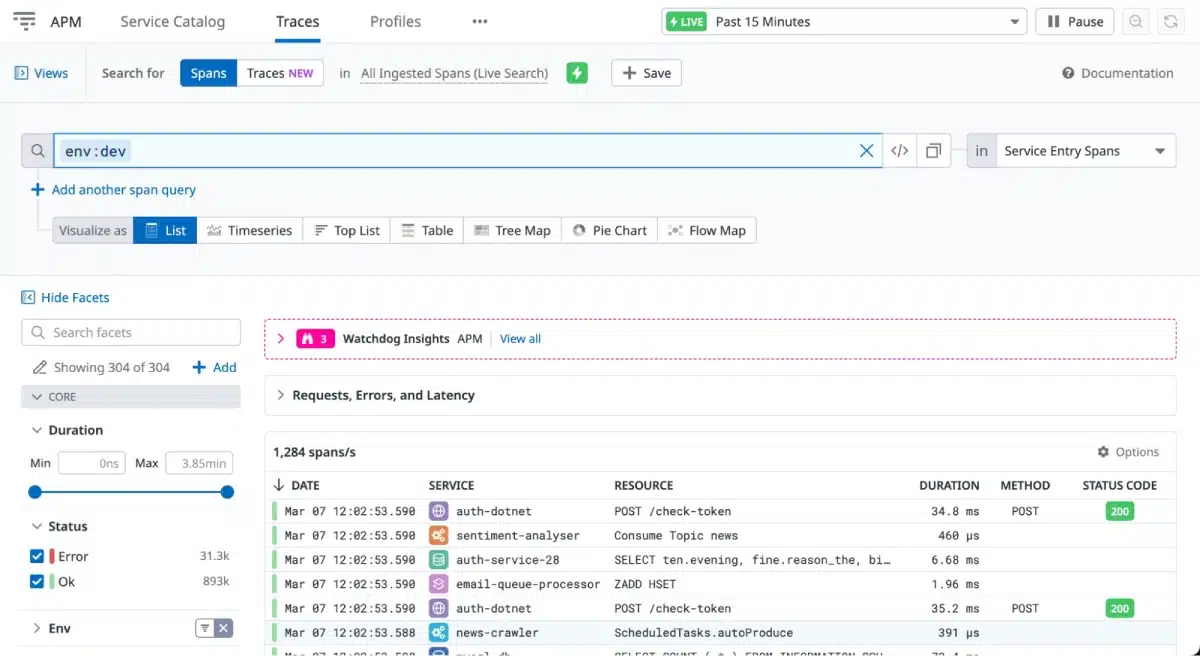
Datadog is one of the most widely used SaaS platforms for monitoring modern applications and infrastructure. It provides APM, log management, user monitoring, and network monitoring in a single cloud platform.
With Datadog, you can monitor distributed traces, metrics, and front-end performance with over 1,000 integrations out-of-the-box. Its dashboards and "single pane of glass" approach makes troubleshooting easy, and it applies machine learning for anomaly detection and forecasting to proactively identify performance issues.
New capabilities include Bits AI SRE for autonomous alert investigations, LLM Observability for AI agents, and GPU monitoring for AI workloads.
Pros:
- Comprehensive feature set: Offers infrastructure, APM, logs, and more in one platform, providing full visibility into each layer of a distributed environment. You can see metrics, traces, and logs side-by-side, which speeds up root cause analysis.
- Extensive integrations: Datadog has over 1,000 built-in integrations covering virtually all popular technologies. This makes it easy to plug Datadog into your stack and pull in data without heavy custom setup.
- Cloud-native and container support: Strong support for Kubernetes, Docker, serverless, and microservices architectures. It's built with cloud scalability in mind and can monitor dynamic, ephemeral infrastructure effectively.
- Powerful dashboards and analytics: Flexible query language and rich visualization options for creating custom dashboards. It also supports features like drag-and-drop dashboard building and out-of-the-box templates. Real-time interactive analytics let you slice and dice data on the fly.
- Alerting and AI insights: Robust alerting engine with integrations into PagerDuty, Slack, etc. Datadog can do anomaly detection and uses machine-learning to cut down alert noise by grouping related issues. Its Watchdog feature automatically surfaces unusual patterns without manual thresholds.
Cons:
- High cost at scale: Costs escalate quickly with more hosts and increased data retention. Free tier is limited to 5 hosts with 1-day retention.
- Learning curve: Interface can feel overwhelming for new users due to numerous features and custom query syntax.
- Cloud-only model: No on-premises option available for organizations with strict data control requirements.
- Agent overhead: You’ll need to install Datadog agents on your hosts and instrument your application with their APM client.
- UI navigation: Some interface elements could be more intuitive, though issues typically resolve with customization.
Ideal for:
DevOps teams and companies running complex cloud-native applications who want a single integrated platform for all monitoring needs. Datadog is great for organizations that value deep visibility and have a budget to invest in a premium SaaS tool to simplify operations.
Pricing:
SaaS, subscription-based. Free trial for 14 days. Datadog offers a limited free tier (up to 5 hosts, 1-day metric retention) for basic monitoring. Paid plans are modular – e.g. APM is priced per host (around $31/host/month for APM), infrastructure monitoring starts at ~$15/host/month, etc. Costs vary based on which modules you enable and your usage (traces, metrics, log volumes). Enterprise volume discounts are available. It’s important to analyze your expected data ingestion and retention needs to estimate Datadog’s cost for your scale.
2. New Relic
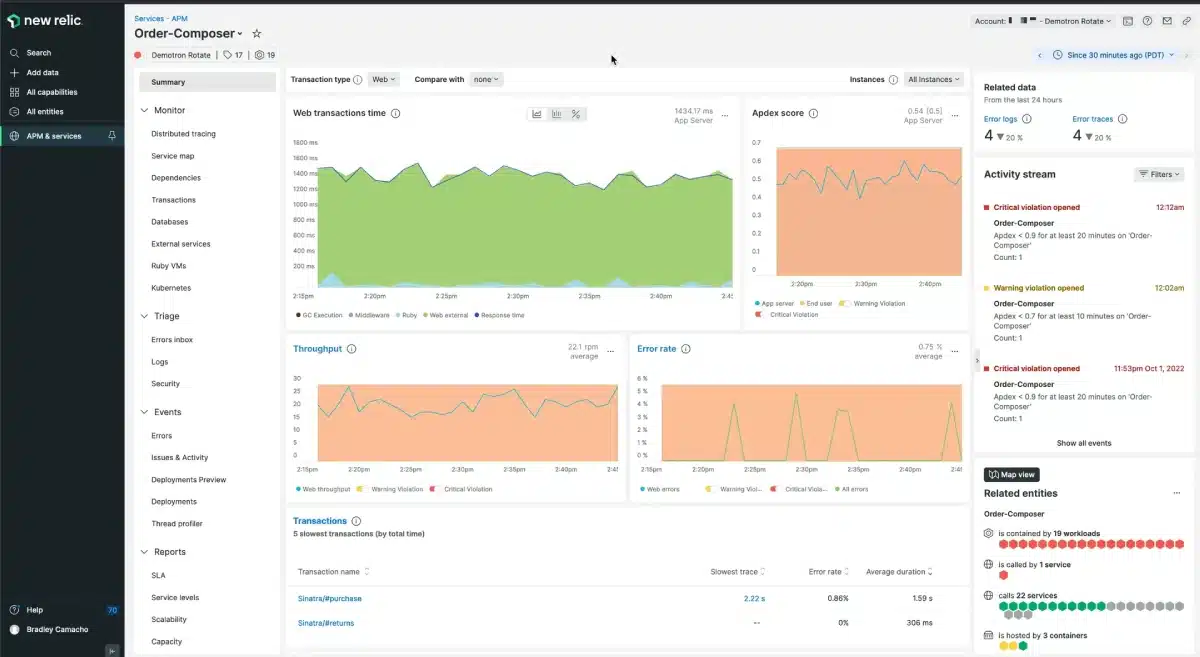
New Relic is a veteran in the APM space that has evolved into a full-stack observability platform covering APM, infrastructure, logs, browser and mobile monitoring, and more. Known for detailed transaction traces, an NRQL query language for custom dashboards, and support for many languages (Java, .NET, Node.js, Python, Ruby, Go, etc.), New Relic offers a unified telemetry platform where metrics, events, logs, and traces are stored together.
Its strongest selling point is the perpetual free tier with 100 GB/month data ingest and one full-access user. Recent updates include agentic AI capabilities and eAPM (eBPF-based Application Performance Monitoring) for instant Kubernetes insights.
Pros:
- All-in-one observability: End-to-end monitoring across apps, infrastructure, Kubernetes, front-end, synthetics, and logs
- Extensive language support: Mature agents for many languages and frameworks, ideal for diverse tech stacks
- Powerful analytics: Unified telemetry database with robust query language for custom analysis
- Automated insights: AI-driven anomaly detection and issue correlation with built-in error tracking
- Generous free tier: 100 GB/month data ingest with full platform capabilities for one user
Cons:
- Complex pricing: Usage-based model can lead to unexpectedly high bills as you scale
- Potentially overwhelming: Vast feature set can be difficult to navigate in large environments
- Historical APM focus: Some newer areas may not be as feature-rich as dedicated tools
- Agent management: Requires configuration effort to optimize agent performance
- Limited on-prem options: New Relic is primarily SaaS. There was a self-hosted option (New Relic Private Minion for synthetics, or an older on-premise appliance) but generally, you send data to New Relic’s cloud. Organizations that prefer an on-prem APM solution would need to look elsewhere.
Ideal for:
Teams that want full-stack observability with a single platform, especially if they are cost-conscious initially. New Relic is ideal for startups, midsize companies, or any organization that can leverage the free tier and then scale up. It’s also well-suited for those needing to monitor a wide range of components (back-end, front-end, mobile, etc.) with one service.
Pricing:
SaaS, usage-based. Free forever tier includes 100 GB/month of data ingest and 1 Full user (plus unlimited basic read-only users). Paid plans come in Standard, Pro, Enterprise – for example, Standard starts at $49/month per full-user with additional costs per GB of data beyond the free allotment. Ingest pricing starts from $0.40 per GB for additional data, and additional full-access users cost extra (around $99/user/month on higher tiers, or included in some enterprise agreements).
The usage model means you pay for what you use (data and users), which can be efficient, but be sure to use New Relic’s cost forecasting tools to avoid surprises. All plans are delivered via New Relic’s cloud (no self-hosted licensing).
3. Dynatrace
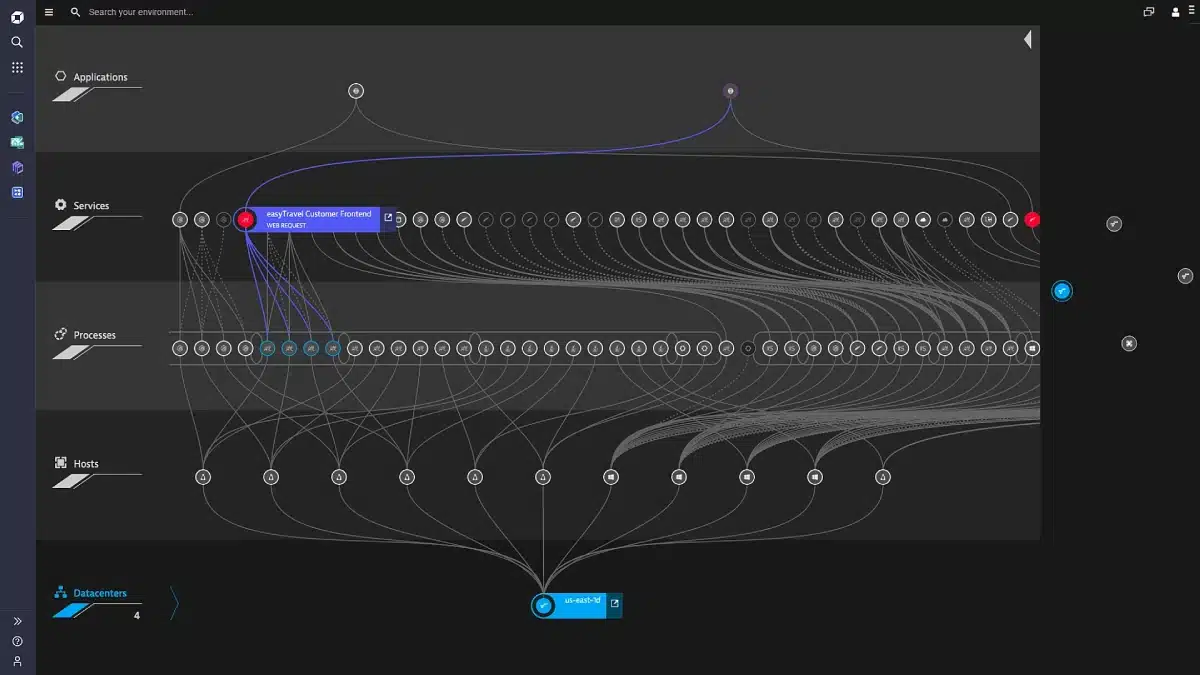
Dynatrace is an enterprise-grade observability platform known for its powerful AI engine (Davis) and automated instrumentation. It provides integrated monitoring for infrastructure, applications, and user experience.
Its standout feature is OneAgent technology – a single agent per host that automatically discovers all services, instruments them, and maps dependencies in real time. Dynatrace continuously baselines performance and uses its Davis AI for root-cause analysis, often pinpointing specific issues without manual setup.
It supports 700+ technologies from cloud VMs to serverless functions, making it ideal for large organizations with complex systems requiring intelligent monitoring.
Pros:
- Automatic instrumentation: Zero-config monitoring that auto-injects into processes and discovers new services automatically
- AI-driven analysis: Davis AI analyzes billions of events to detect anomalies and pinpoint root causes
- Full-stack monitoring: Covers infrastructure, application performance, and Real User Monitoring with business metrics
- Enterprise scalability: Handles thousands of hosts with clustered architecture, role-based access, and ITSM integration
- Strong ecosystem: Built-in support for major cloud platforms, Kubernetes, and CI/CD pipelines
Cons:
- Premium pricing: One of the more expensive APM solutions with custom pricing and no ongoing free tier
- Learning curve: Powerful but complex system requiring time to fully leverage and tune properly
- Resource usage: OneAgent consumes noticeable memory/CPU resources on monitored hosts
- Bundled pricing: Less flexible tiers that may require paying for unused features
- Limited customization: Auto-generated dashboards with fewer options for bespoke visualizations
Ideal for:
Large enterprises, cloud-native or hybrid environments, and organizations running at massive scale. Dynatrace is best for teams that want hands-off automation and AI assistance in monitoring – for example, a financial or e-commerce company with hundreds of microservices in production, where manually configuring monitors isn’t feasible. If you need a “set it and forget it” APM with smart analytics and have the budget for a premium solution, Dynatrace is a top choice.
Pricing:
15-day free trial available. Dynatrace offers transparent, usage-based pricing: infrastructure monitoring starts at $29/month per host, while full-stack monitoring runs $58/month per 8 GiB host. Enterprise customers typically receive custom quotes based on their specific usage and volume requirements. There is no free tier beyond the trial.
Dynatrace also offers a Managed (self-hosted) deployment for an extra premium, which some large customers opt for. Dynatrace is on the higher end of cost, typically sold via annual subscriptions, though the transparent pricing model makes it easier to estimate costs upfront.
4. Splunk AppDynamics
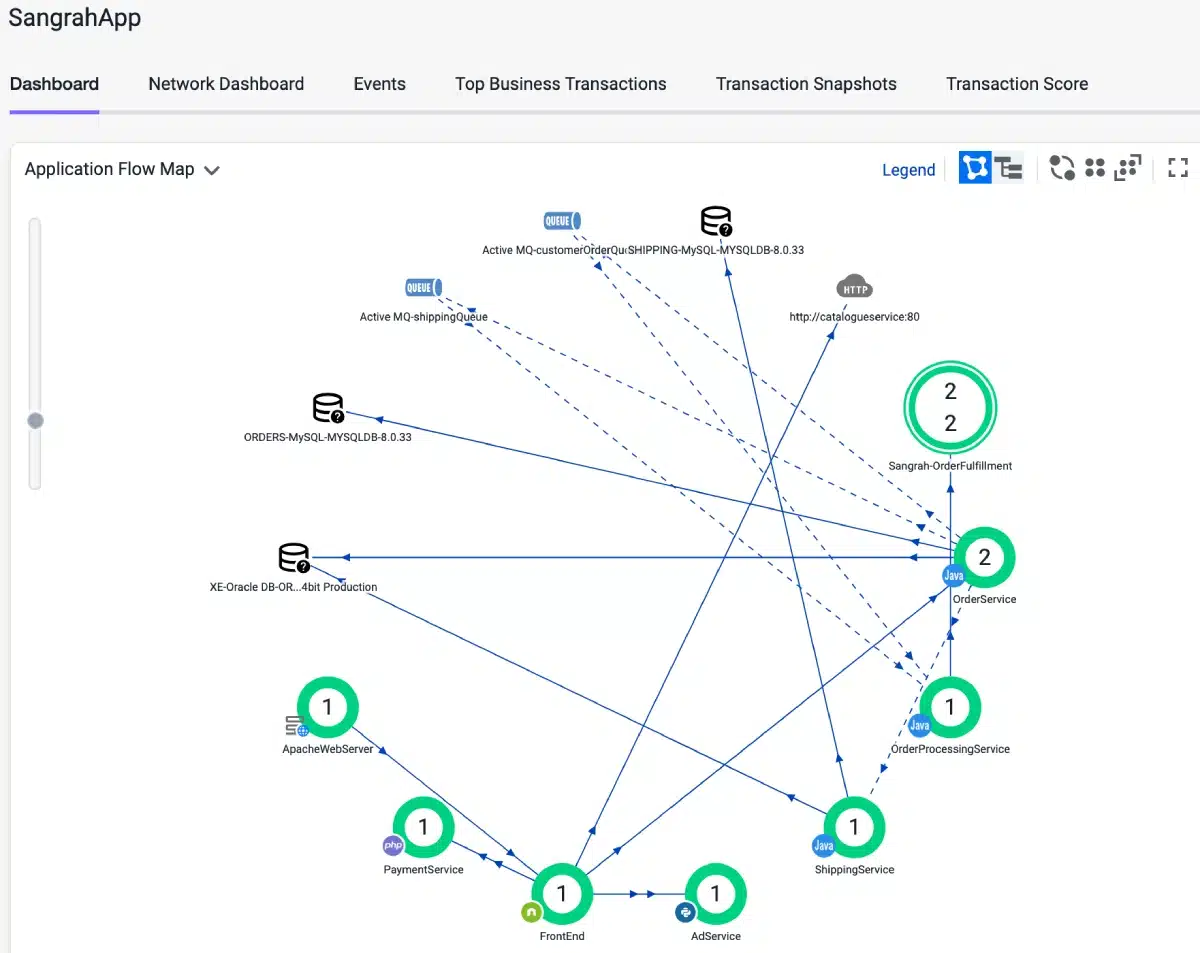
AppDynamics (now part of Splunk following Cisco's 2024 acquisition) is a leading APM solution focused on business transaction performance. It monitors applications at code level, tracking each transaction flow through the application stack and correlating technical metrics with business outcomes. Its Business iQ analytics ties application performance to business results in real time.
With end-to-end monitoring and strong support for enterprise technologies like Java, .NET, and SAP, Splunk AppDynamics uses agent-based architecture reporting to a controller (SaaS or on-prem). The platform now integrates deeply with Splunk Observability Cloud, offering unified SSO, Log Observer Connect for context-preserving deep linking, and a new OpenTelemetry-based agent that can send data to either Splunk AppDynamics or Splunk Observability Cloud.
Pros:
- Business transaction focus: Automatically detects and monitors business transactions, aligning IT metrics with business KPIs
- Code-level diagnostics: Provides deep visibility with stack traces and SQL queries for pinpointing exact slowdown causes
- Enterprise-proven: Battle-tested in large environments with on-premises deployment options
- Intelligent alerting: Uses dynamic baselining to reduce alert fatigue and focus on significant changes
- Broad platform support: Covers major languages, databases, and servers with customization options
Cons:
- Complex setup: Requires more manual configuration than newer auto-instrumenting APMs
- Dated interface: Less intuitive navigation compared to competitors despite ongoing updates
- High cost: Expensive per-agent pricing model with no free tier beyond trial period
- Performance impact: Agent overhead requires tuning in performance-sensitive environments
- Organizational transition: Uncertainty from Cisco/Splunk acquisition may impact future direction
Ideal for:
Enterprises that have mission-critical applications where performance directly ties to business success – for example, finance, e-commerce, telecom, and other industries with complex transaction flows. It’s especially useful when you need to monitor legacy enterprise applications or a mix of legacy and modern, with an emphasis on understanding the business impact of performance issues. Organizations that require on-premises APM for security or compliance also choose AppDynamics for its deploy-anywhere flexibility.
Pricing:
Enterprise license. 14-day free trial available for AppDynamics SaaS. Post-trial, licensing is typically by agent or CPU core. For instance, you might purchase an APM agent license for each application server. Exact pricing isn’t public (custom quotes), but expect it to be on the higher side. Some estimates put APM agent licenses in the thousands of dollars per year range each.
No free tier is offered; however, if you’re a Cisco customer, sometimes AppDynamics is offered in package deals. For now, plan for a significant investment if you go with AppDynamics across many nodes.
5. Splunk Observability Cloud
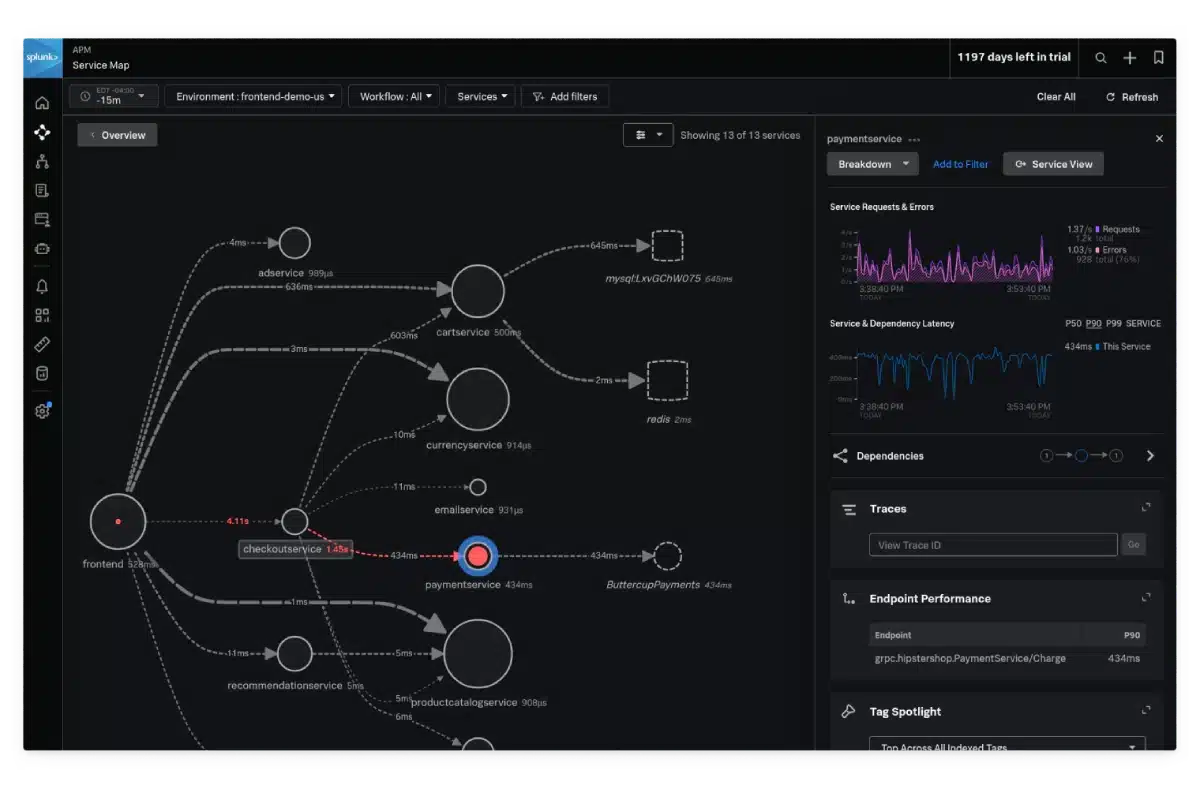
Splunk Observability Cloud – which includes what was formerly SignalFx APM (and Omnition tracing) – is a top-tier APM and observability solution particularly suited for large-scale data analytics. It differentiates itself with NoSample™ full-fidelity tracing, capturing 100% of transactions without sampling for retroactive analysis.
Following Cisco's acquisition of Splunk, the platform has added AI Troubleshooting Agents, Business Insights correlation, ThousandEyes RUM integration, and session replay for mobile and browser applications.
Pros:
- Full-fidelity tracing: Captures every transaction without sampling, ensuring no outlier events are missed
- High-performance analytics: Built to quickly ingest and query large data volumes with optimized storage
- AI-powered alerts: Includes anomaly detection, adaptive thresholds, and sophisticated alert routing
- Rich ecosystem: Tight integration with Splunk logs and SIEM, plus OpenTelemetry support
- Flexible visualization: Robust UI with customizable dashboards and powerful trace querying capabilities
Cons:
- Expensive: High costs tied to data volume with no free tier beyond trial period
- Learning curve: Requires expertise to fully utilize advanced analytics features
- Cloud-only model: No self-hosting option for the Observability Cloud components
- Interface separation: Some siloing between Observability Cloud and Splunk Enterprise
- Requires good data hygiene: To avoid ballooning costs and to make the most of Splunk APM, you need to be smart about the data you send. Tuning sampling rates, adjusting trace detail levels, and setting appropriate retention policies are necessary to keep things efficient, but adds operational overhead in managing what data you collect.
Ideal for:
Large enterprises, cloud-native or hybrid environments, and organizations running at massive scale. Splunk Observability Cloud is best for teams that need full-fidelity tracing and powerful analytics, especially those already invested in the Splunk ecosystem. Following Cisco's acquisition, it's positioned for cloud-native microservices architectures, while Splunk AppDynamics handles three-tier and hybrid applications.
Pricing:
Subscription-based. Free trial available (typically 14-30 days). No ongoing free tier. Current pricing: Infrastructure starts at $15/host/month, App & Infra at $60/host/month, and End-to-End at $75/host/month (annual billing). Costs vary based on which modules you enable and your usage (traces, metrics, spans ingested). Contact Splunk for enterprise volume pricing.
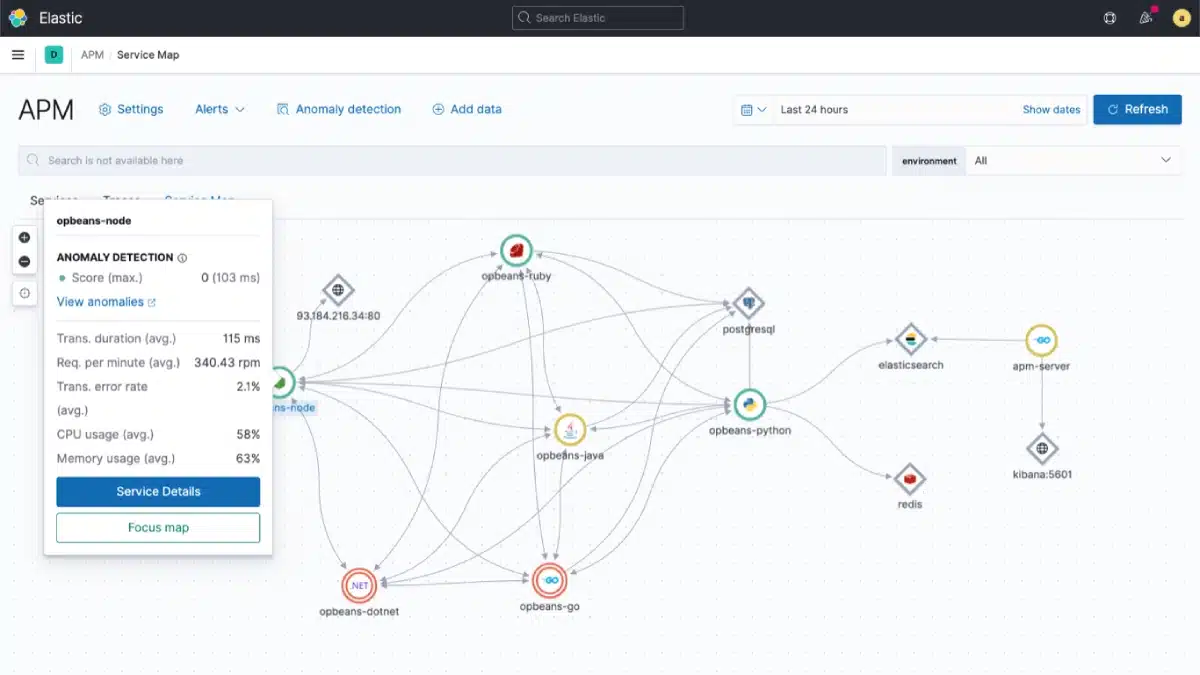
6. Elastic APM
Elastic APM is the application performance monitoring part of the Elastic Stack (formerly known as the ELK Stack: Elasticsearch, Logstash, Kibana). It's a free and open-source solution you can self-host, with optional paid features and cloud hosting. In August 2024, Elastic returned to being fully open source by adding AGPLv3 licensing alongside SSPL and Elastic License 2.0, reversing the controversial 2021 license change.
While it may lack some advanced features of commercial tools, it covers core APM needs and is accessible to budget-conscious teams.
Pros:
- Free and open-source: Self-hostable with no licensing cost for basic features
- ELK stack integration: Seamlessly combines logs and APM data in one platform
- Comprehensive monitoring: Includes Real User Monitoring and automatic service maps
- Highly customizable: Flexible storage options and custom metric capture capabilities
Cons:
- Maintenance overhead: Requires managing Elasticsearch clusters and APM servers
- Scaling challenges: May need substantial resources for high-volume trace workloads
- Feature limitations: Lacks some advanced capabilities of commercial competitors
- Tiered licensing: Advanced features require paid Elastic license tiers
- Agent footprint: Can add noticeable memory overhead in resource-constrained environments
Ideal for:
Teams that are already using the Elastic Stack for logging or metrics and want to extend into APM without adopting a separate product. Also ideal for organizations that require an on-premise, open-source solution due to security or cost reasons. Elastic APM is great for small to medium-sized companies or any group that has the expertise to run Elasticsearch and wants a budget-friendly yet capable APM solution.
Pricing:
Free self-hosted version: The basic APM solution is free to use; you just incur hardware/VM costs for running it.
Elastic Cloud: Pricing is based on the size of the Elasticsearch cluster and data retention. A small APM setup might start at around $95/month on Elastic Cloud for modest data volumes. As you scale, you’d move to larger resource tiers. For on-prem deployments requiring enterprise support and advanced capabilities, Elastic subscriptions can range from a few thousands to tens of thousands of dollars per year depending on cluster size. But if you only use the free features, you pay $0 in license fees.
In summary, Elastic APM can be very cost-effective, especially if you leverage the free capabilities; just account for the operational cost if self-managing.
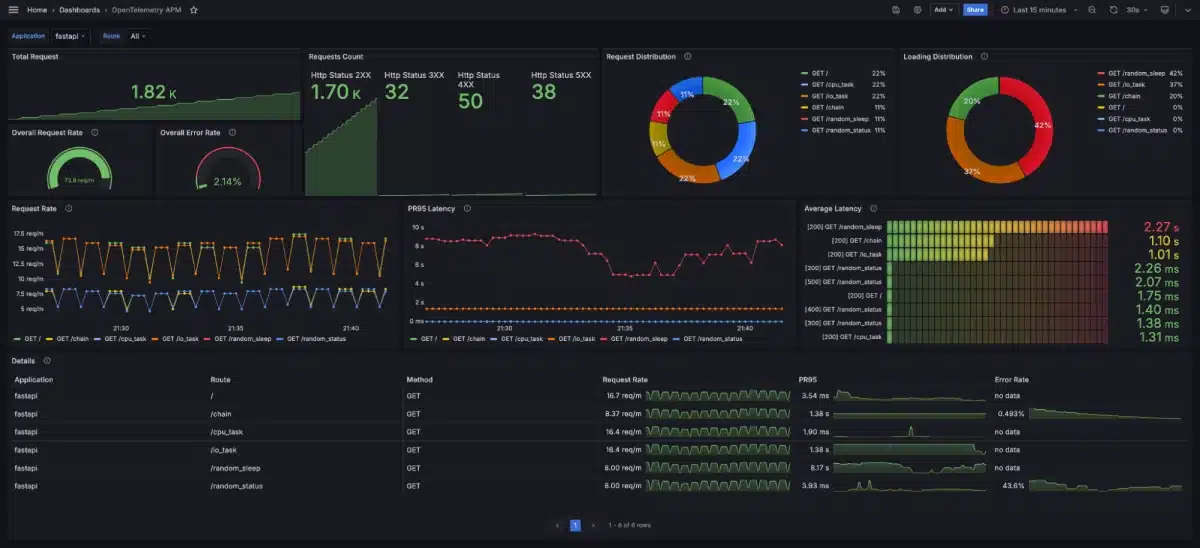
7. Prometheus & Grafana
Prometheus and Grafana together form a popular open-source monitoring stack often used as a DIY APM solution. Prometheus excels at time-series metrics collection in cloud-native environments, while Grafana provides visualization through dashboards and graphs. While not an APM tool in the strictest sense (Prometheus by itself focuses on metrics, not tracing), this combo is widely used to monitor application performance metrics like latency, throughput, and resource usage.
The Prometheus & Grafana stack is highly flexible, completely free to use, and supported by a large community.
Pros:
- Fully open-source: Free to use without licensing costs, with managed versions available
- Powerful analysis: PromQL query language with rich visualization capabilities in Grafana
- Extensive integrations: Hundreds of exporters and compatibility with multiple data sources
- Cloud-native design: Pull-based model ideal for Kubernetes with automatic service discovery
- Complete customization: Total control over retention, resolution, and instrumentation
Cons:
- Not turnkey: Requires assembly of multiple components for complete observability
- Operational complexity: Single-node architecture needs additional tools for scaling
- Limited retention: Prometheus by default stores data locally (typically in the order of weeks). Long-term retention or comparative analysis over months/years is not straightforward unless you use remote storage or archive metrics.
- Basic alerting: Lacks advanced anomaly detection without custom configuration
- Steep learning curve: Requires expertise in PromQL and metrics instrumentation
Ideal for:
Organizations that prefer open-source solutions and want full control over their monitoring setup. It’s particularly well-suited for DevOps teams in cloud-native environments (Kubernetes), as Prometheus is the de facto standard for K8s metrics.
If your primary need is metrics and alerting, and you’re willing to integrate other pieces for logs/traces as needed, this stack is perfect.
Pricing:
Free (self-managed) or low-cost hosted. The software itself is free. You’ll incur costs for the infrastructure to run it (e.g., VMs for Prometheus server, storage for metrics, etc.).
In the cloud, this might be minimal for small setups (say, one t2.medium instance for Prometheus). Grafana Labs offers Grafana Cloud which has a generous free tier (10k series for Prometheus metrics, 14-day retention, 3 team members) and then paid plans as you scale, which can be a cost-effective way to get a managed Prom+Grafana with less effort.
For self-hosting, the main “cost” is engineering time to maintain it.
Overall, Prometheus/Grafana is one of the most cost-efficient approaches to monitoring, since you’re mostly paying with your time and infrastructure rather than license fees.
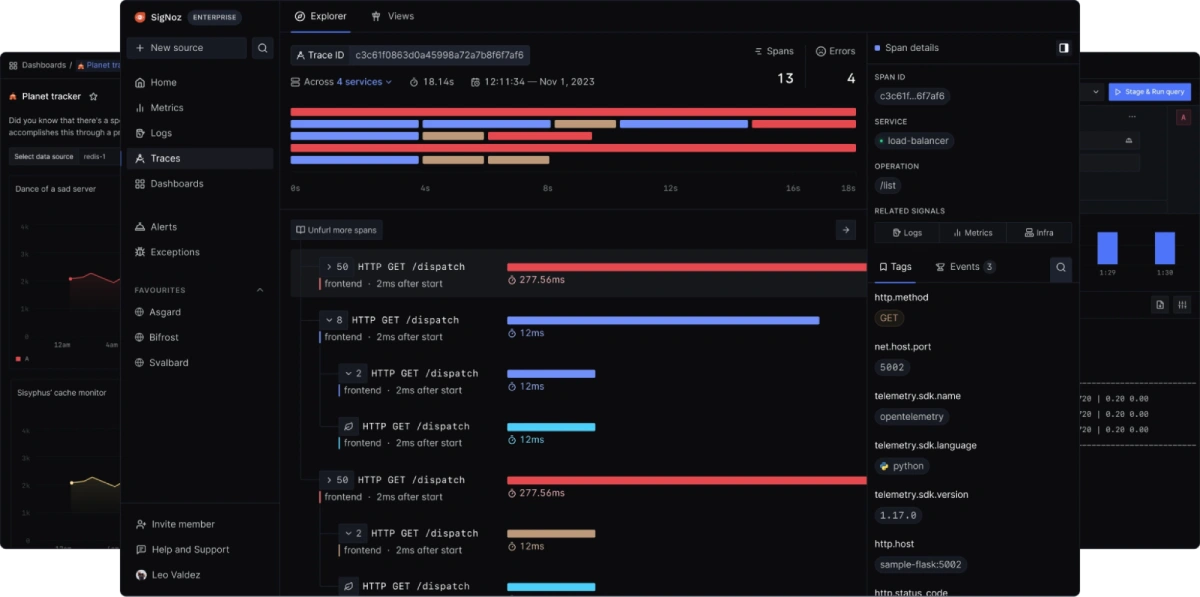
8. SigNoz
SigNoz is an emerging open-source APM platform that positions itself as a self-hosted alternative to Datadog or New Relic.
With 24K+ GitHub stars and an active community, SigNoz is ideal for organizations wanting full-stack APM capabilities without SaaS licensing costs, who are comfortable managing their own observability infrastructure.
Pros:
- Open-source freedom: Free under Apache 2.0 license with full data control and no vendor lock-in
- Unified platform: Single interface for metrics, traces, exceptions, and logs
- OpenTelemetry native: Built on industry-standard instrumentation with wide language support
- Efficient performance: ClickHouse backend handles high data volumes with fast queries
- Enterprise features: Custom dashboards, filtered traces, and alerting without premium costs
Cons:
- Newer project: Started around 2021 with less maturity than established solutions
- Limited ecosystem: Smaller selection of plugins and extensions than older platforms
- Self-hosting overhead: Requires managing deployment, upgrades, and scaling
- Community support: Lacks enterprise support options for the self-hosted version
- Evolving feature set: Some advanced capabilities still under development
Ideal for:
Companies that want a full-featured APM but self-hosted and open source. It’s a great choice for mid-size tech companies or startups that are outgrowing basic monitoring and considering Datadog/NewRelic, but balk at the cost.
Developers who love open-source will appreciate SigNoz as a project they can contribute to or customize. It’s basically for those who want a “Datadog-like” experience on-prem.
Pricing:
The open-source self-managed version is free. You deploy it on your own infrastructure, so costs are just the servers and time.
SigNoz Cloud starts at $49/month base price (reduced from $199 in 2025) with usage-based pricing at $0.30/GB for logs and traces, and $0.10 per million metric samples. Unlimited team members included with no per-host fees.
In summary, self-hosted SigNoz = $0 license cost, and if you choose their cloud, it’s paid but with simpler setup; either way, it will generally be more cost-effective than mainstream APM vendors, especially as you scale.
Comparison Table: Key Differences Between APM Tools
To help summarize, here’s a side-by-side comparison of the eight APM tools reviewed, highlighting what each is “best for,” a standout feature, and whether they offer a free plan:
| APM Tool | Best For | Standout Feature | Free Plan/Trial |
| Datadog | All-in-one cloud monitoring (SaaS) | 1,000+ integrations; unified metrics+traces+logs | Free 14-day trial (5 hosts free basic) |
| New Relic | Full-stack observability on a budget | Generous perpetual free tier (100 GB/mo + 1 user); powerful NRQL analytics | Yes – Free tier (100 GB/mo) + free plan, paid usage beyond |
| Dynatrace | Large enterprise, AI-driven insights | Davis AI engine for auto root cause analysis; OneAgent auto-instrumentation | Free 15-day trial (no free tier) |
| Splunk AppDynamics | Business transaction monitoring (enterprise) | Business iQ linking perf to business KPIs; on-prem deployment option | Free 14-day trial (no free tier) |
| Splunk APM | Analytics at massive scale | No-sampling full-fidelity tracing; advanced analytics & AI alerts | Free trial (usually 14-30 days); no free tier |
| Elastic APM | Open-source ELK Stack users | Seamless Elastic Stack integration; Kibana service maps & search; now fully open source (AGPLv3) | Yes – Open-source self-hosted; Elastic Cloud trial available |
| Prometheus + Grafana | DIY open-source monitoring | Flexible PromQL queries; highly customizable Grafana dashboards | Yes – Completely free (self-managed); Grafana Cloud free tier |
| SigNoz | Self-hosted Datadog alternative | OpenTelemetry-native all-in-one APM; unified UI for metrics & traces | Yes – Open-source (self-hosted); SigNoz Cloud (paid) |
Choosing the Right APM
Selecting the best APM tool for your team comes down to your specific needs, environment, and budget. SaaS platforms like Datadog, New Relic, Dynatrace, and Splunk offer convenience and a rich feature set – they shine if you need turn-key solutions with strong support and don’t mind the premium cost. Open-source options like Elastic APM, Prometheus/Grafana, and SigNoz can dramatically lower costs and provide more control, but require you to manage the monitoring infrastructure and possibly integrate multiple tools.
When evaluating APM solutions, keep the key criteria in mind: Does it cover all the metrics and traces you care about? Is it easy enough to deploy and use for your team? Does it integrate well with your stack and workflow? Can it scale with your traffic? And of course, does it provide good value for the money (or time) you’ll invest? A great approach is to take advantage of free trials or free tiers – spin up a couple of these tools in a staging environment and see which one gels best with your team’s style.
Whether you choose a proven enterprise solution or a cutting-edge open-source project, implementing a solid APM practice will pay dividends in reliability and performance. Here's to smooth user experiences and lightning-fast apps!