Introducing Rollbar’s Usage Visualizations
New Account and Project Graphs
We are excited to unveil the latest enhancement to Rollbar's platform - the integration of graphical visualizations in the usage page. Building on our new usage page, this feature brings a dynamic and intuitive way to monitor and manage your occurrences.
Visualizing Your Occurrences and Budgets
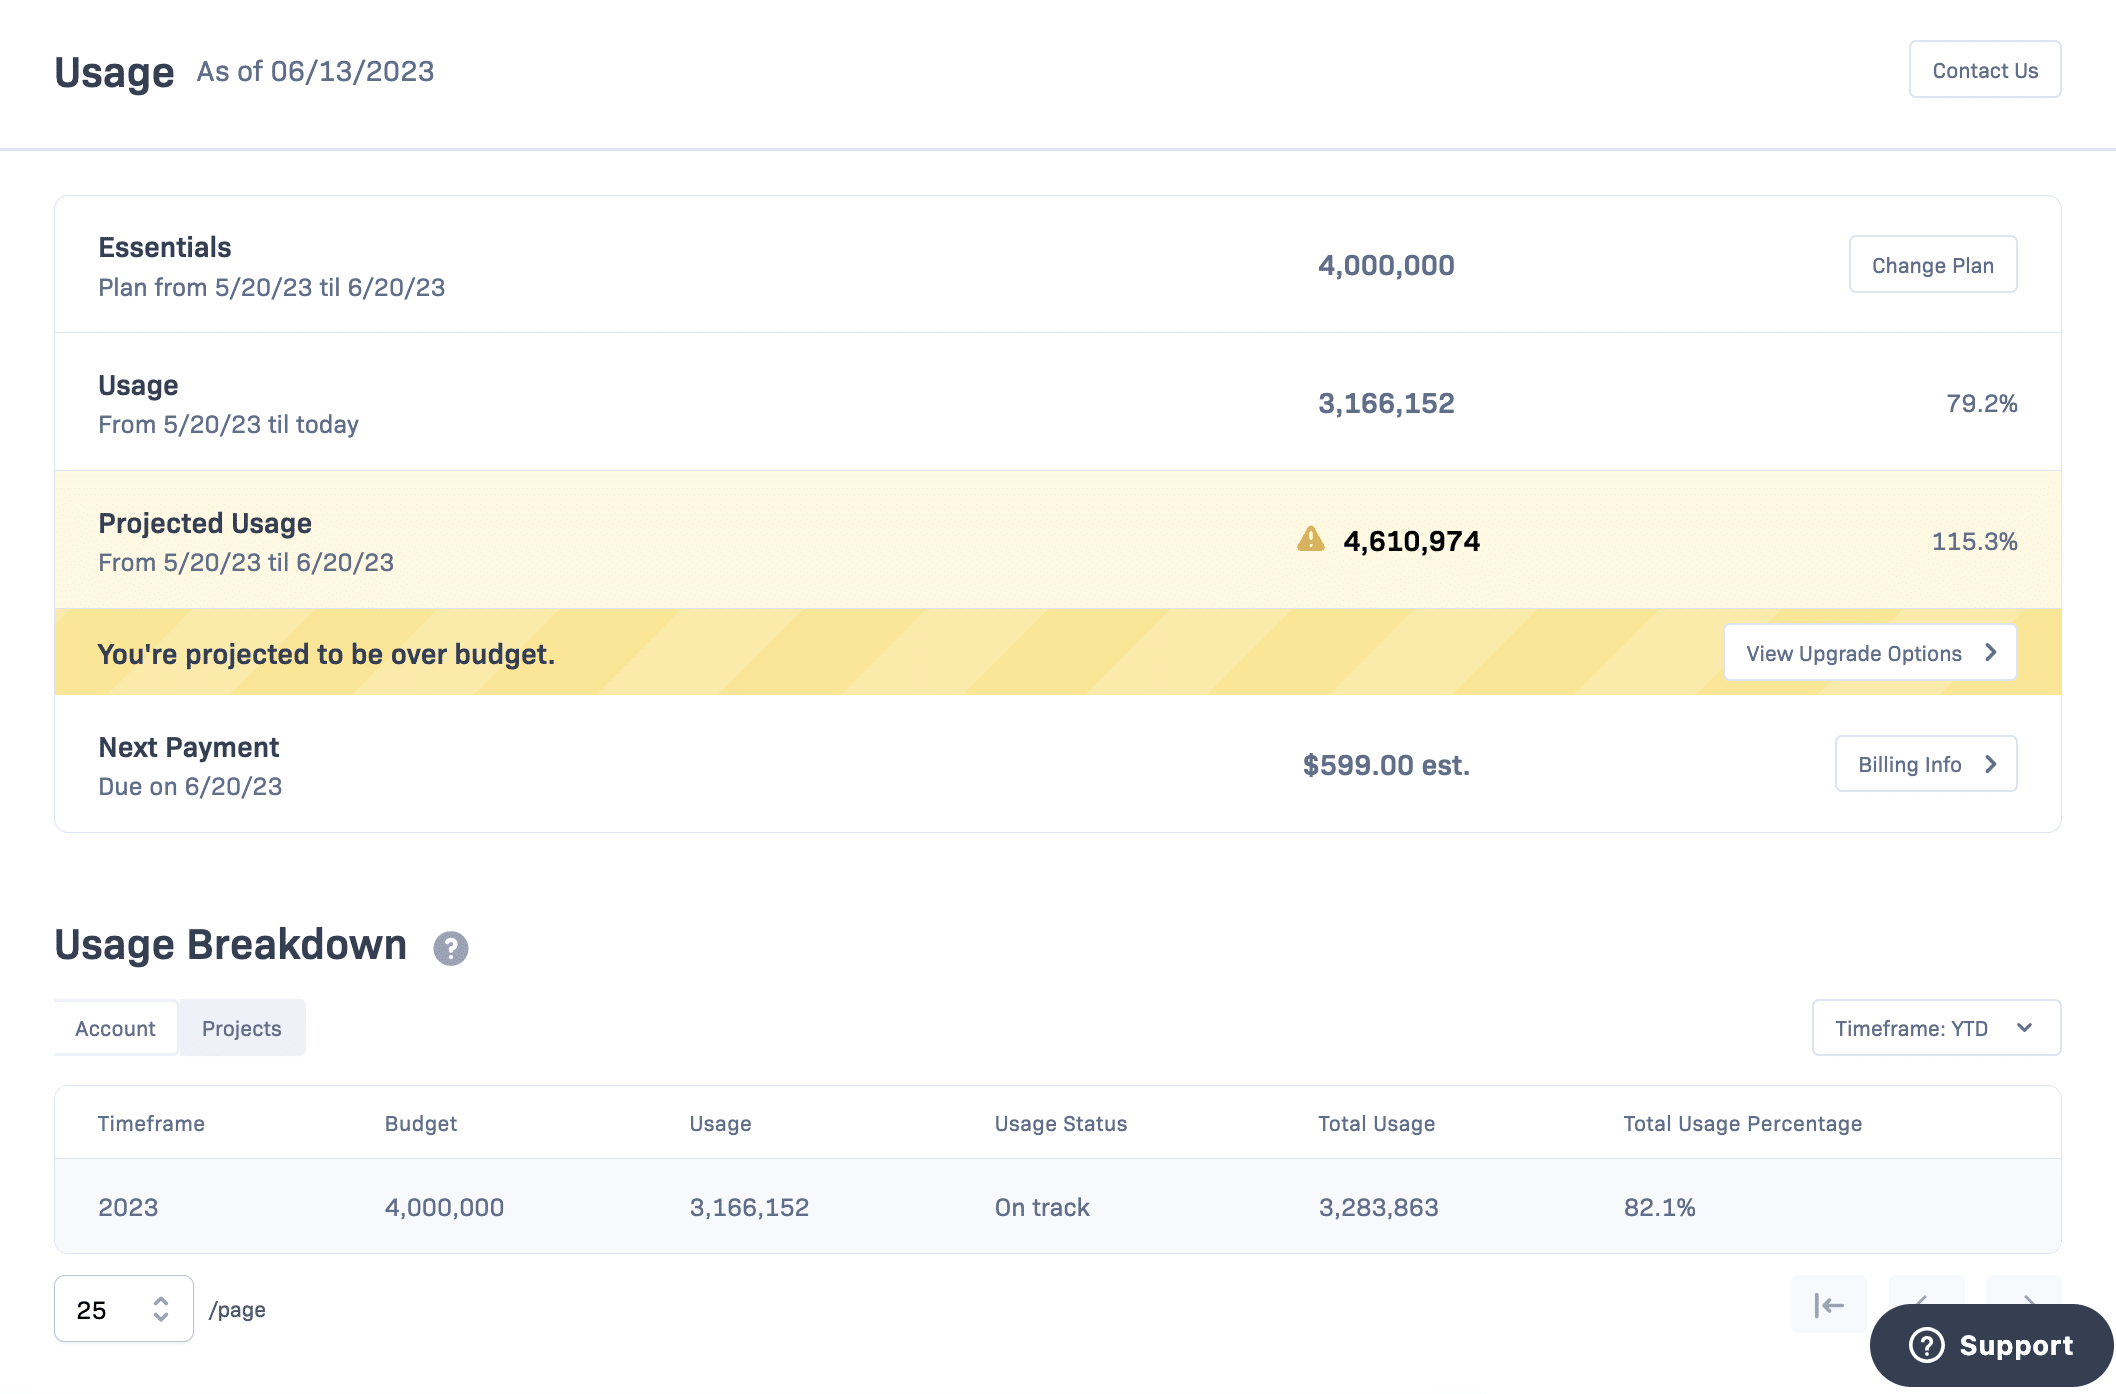
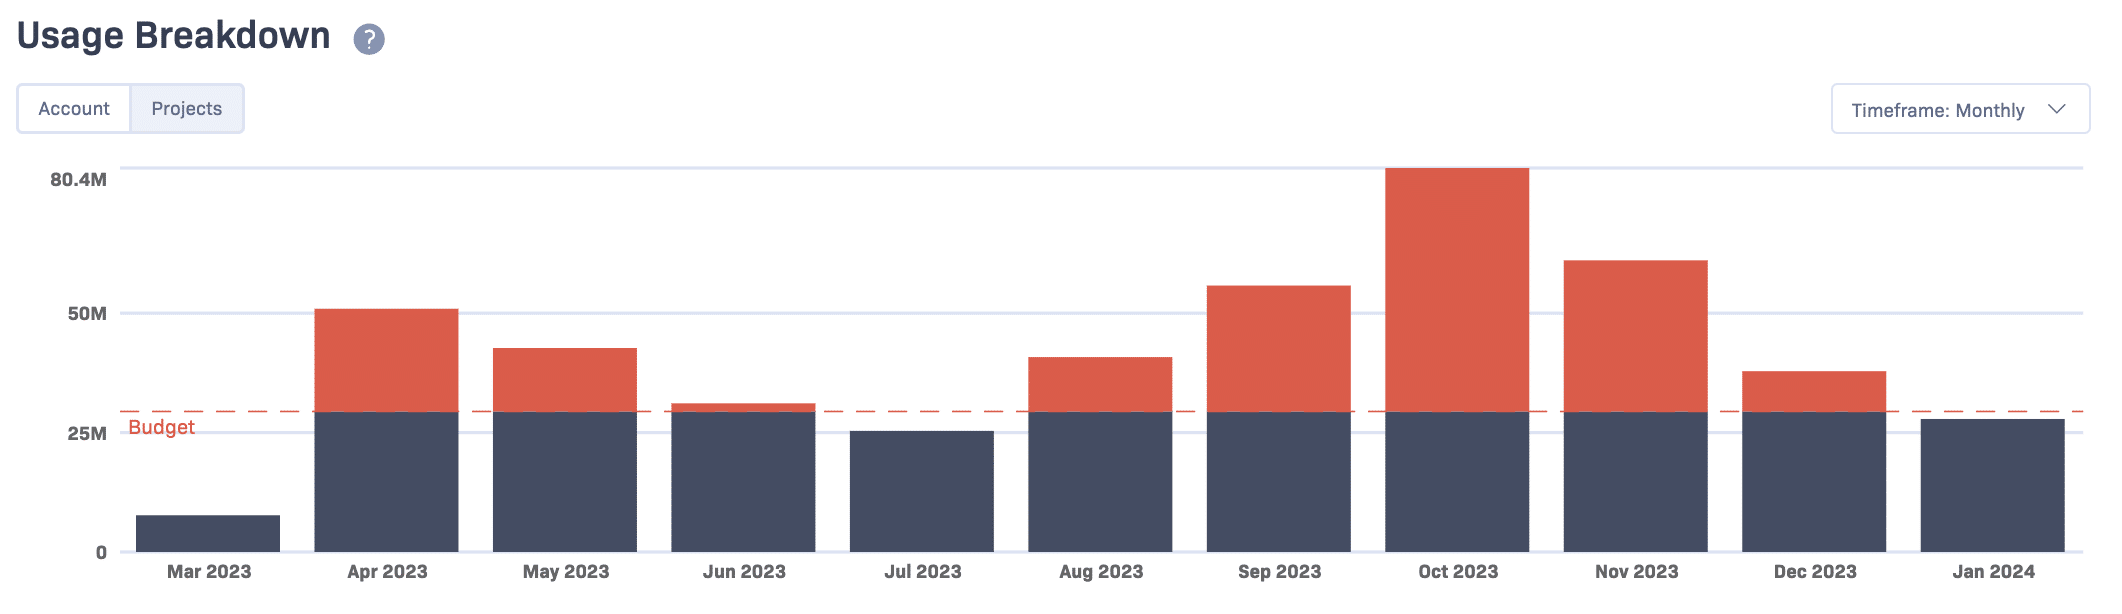
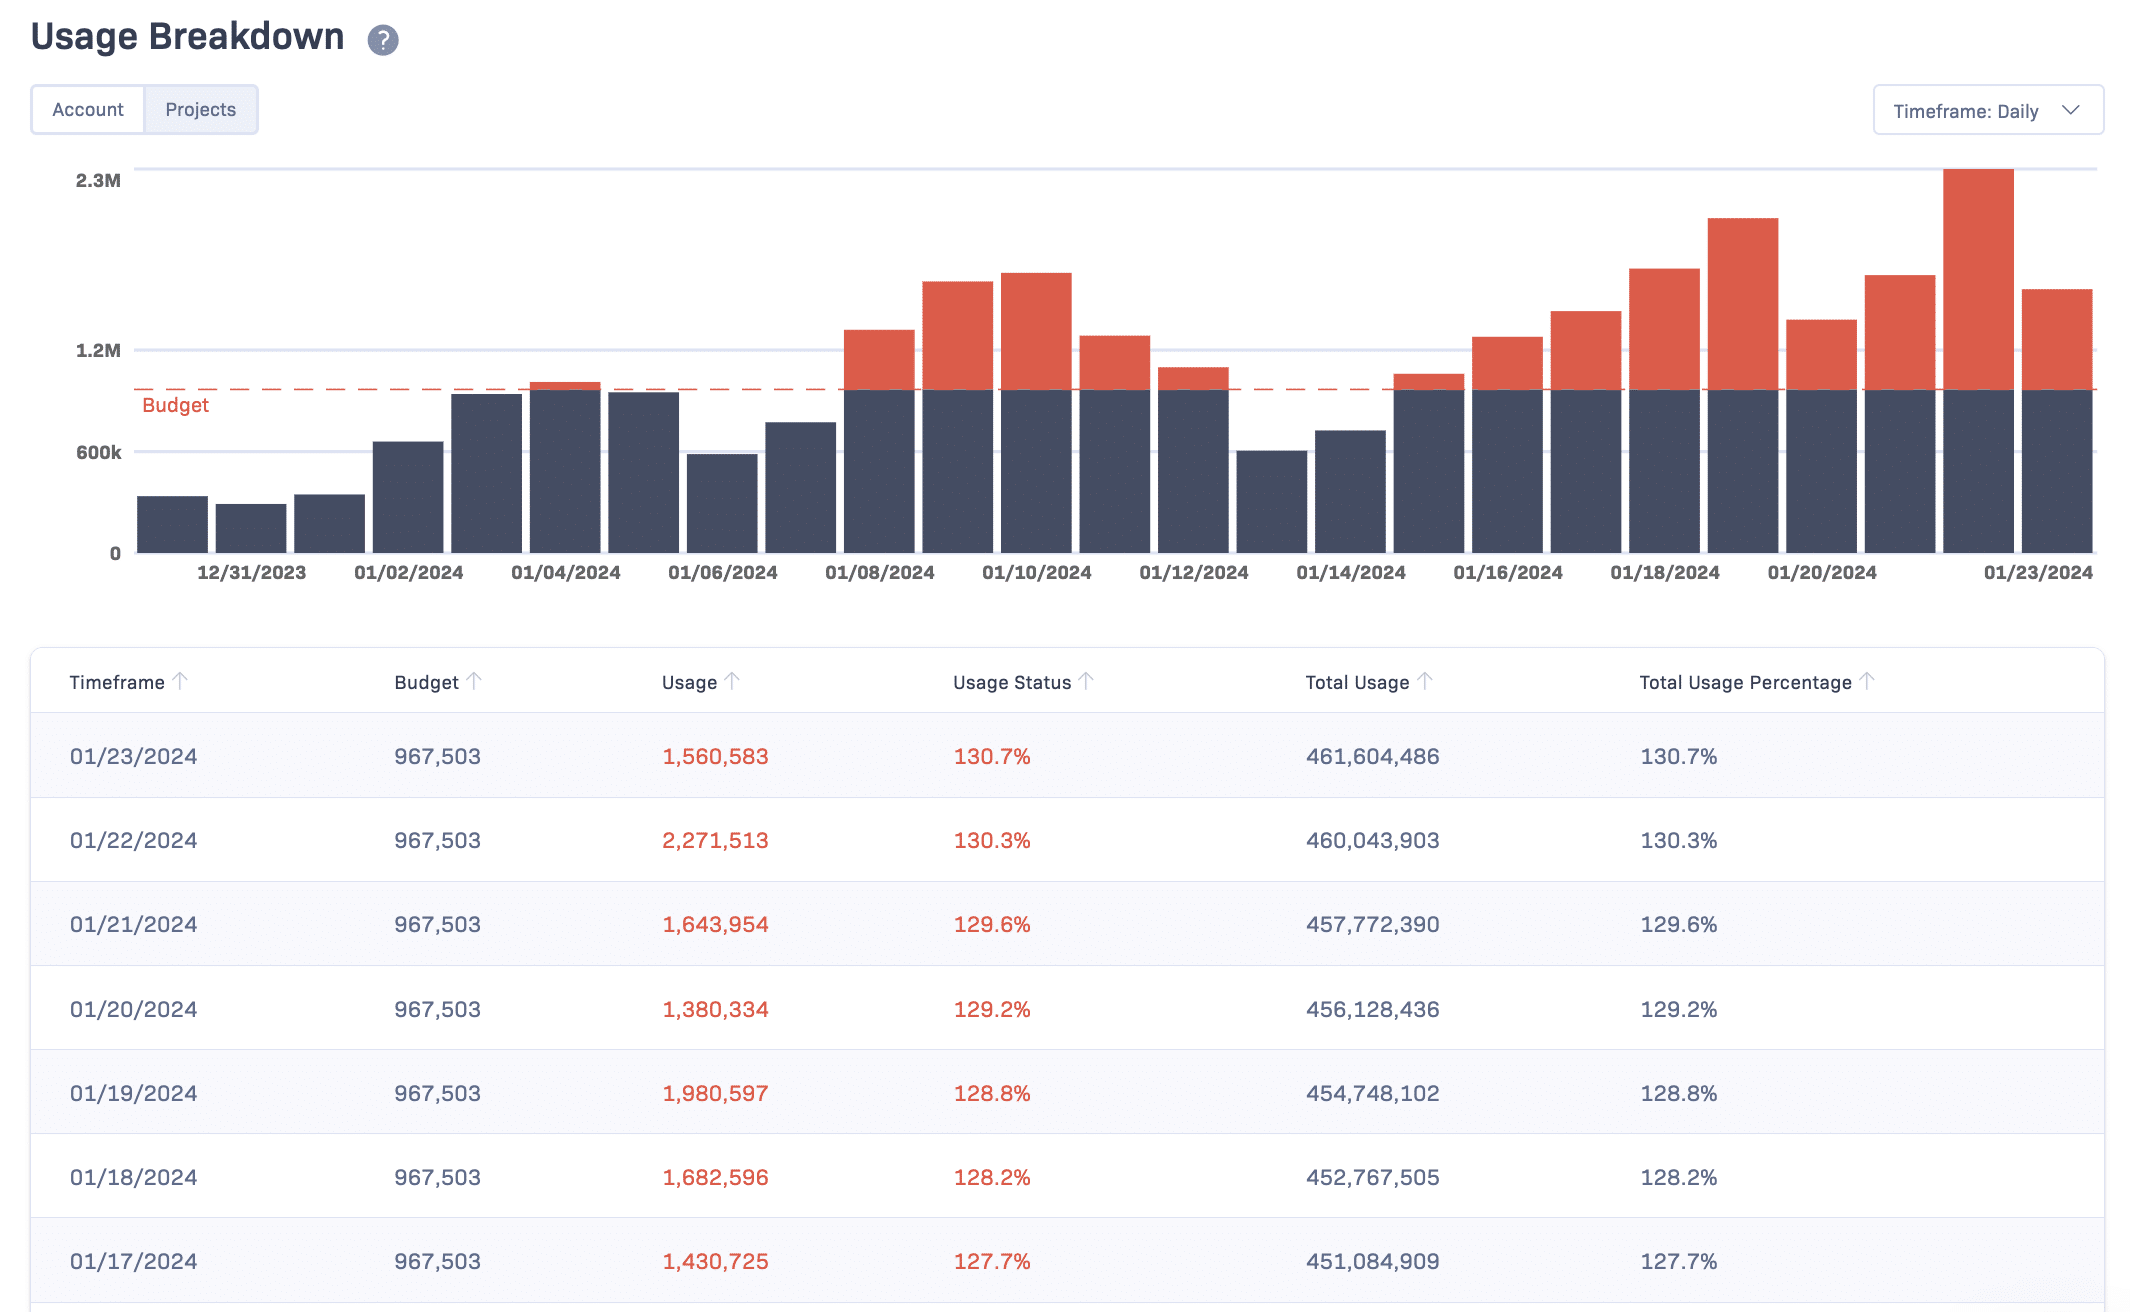
In response to your feedback, we've made some enhancements to the usage page. First, we’ve updated the default view to a daily perspective, allowing for a more granular understanding of occurrences. Alongside this, we’ve introduced a new graphical visualization of your occurrences. Users can now see a clear, color-coded graph showing their account's occurrences against a suggested budget for each time frame. Integrating daily insights and budget visualization offers a more transparent, practical view of your usage and where your application might have used more occurrences than expected.
Project-Level Insights
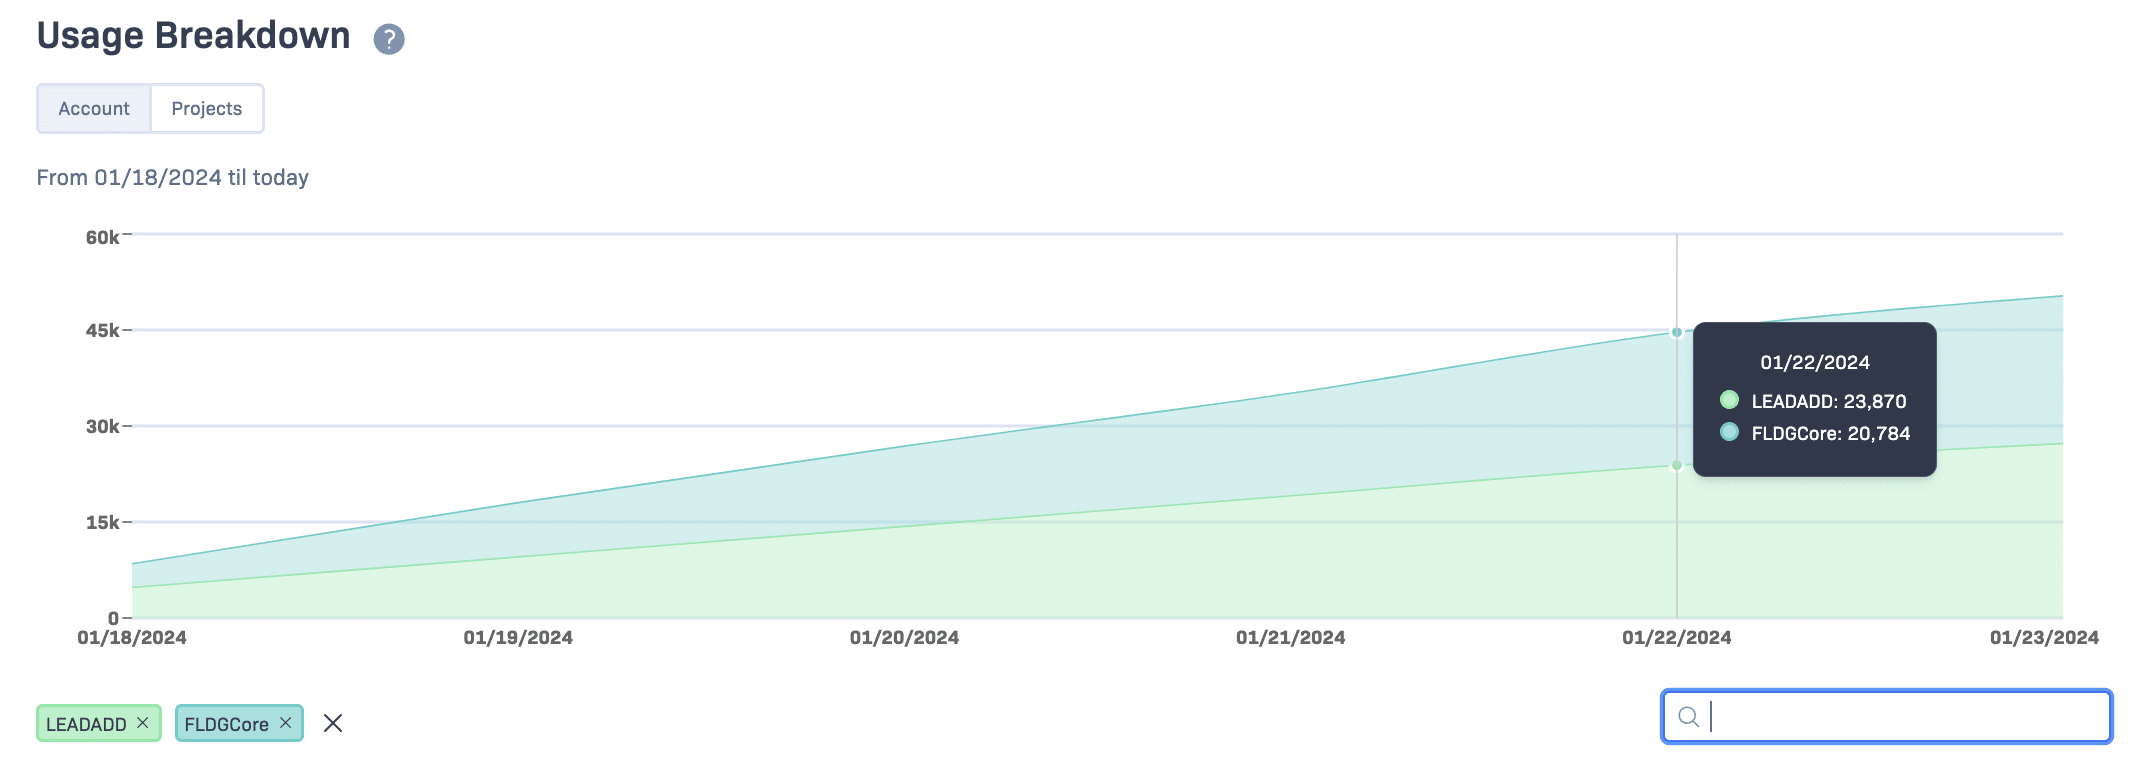
The projects tab now shows usage share per project for up to five projects, which users can select from their account. This flexibility allows for a tailored comparison of how different projects consume occurrences throughout the contract period. Whether you’re monitoring the top five projects by usage or a custom selection, this feature provides a straightforward way to compare and understand project-level data.
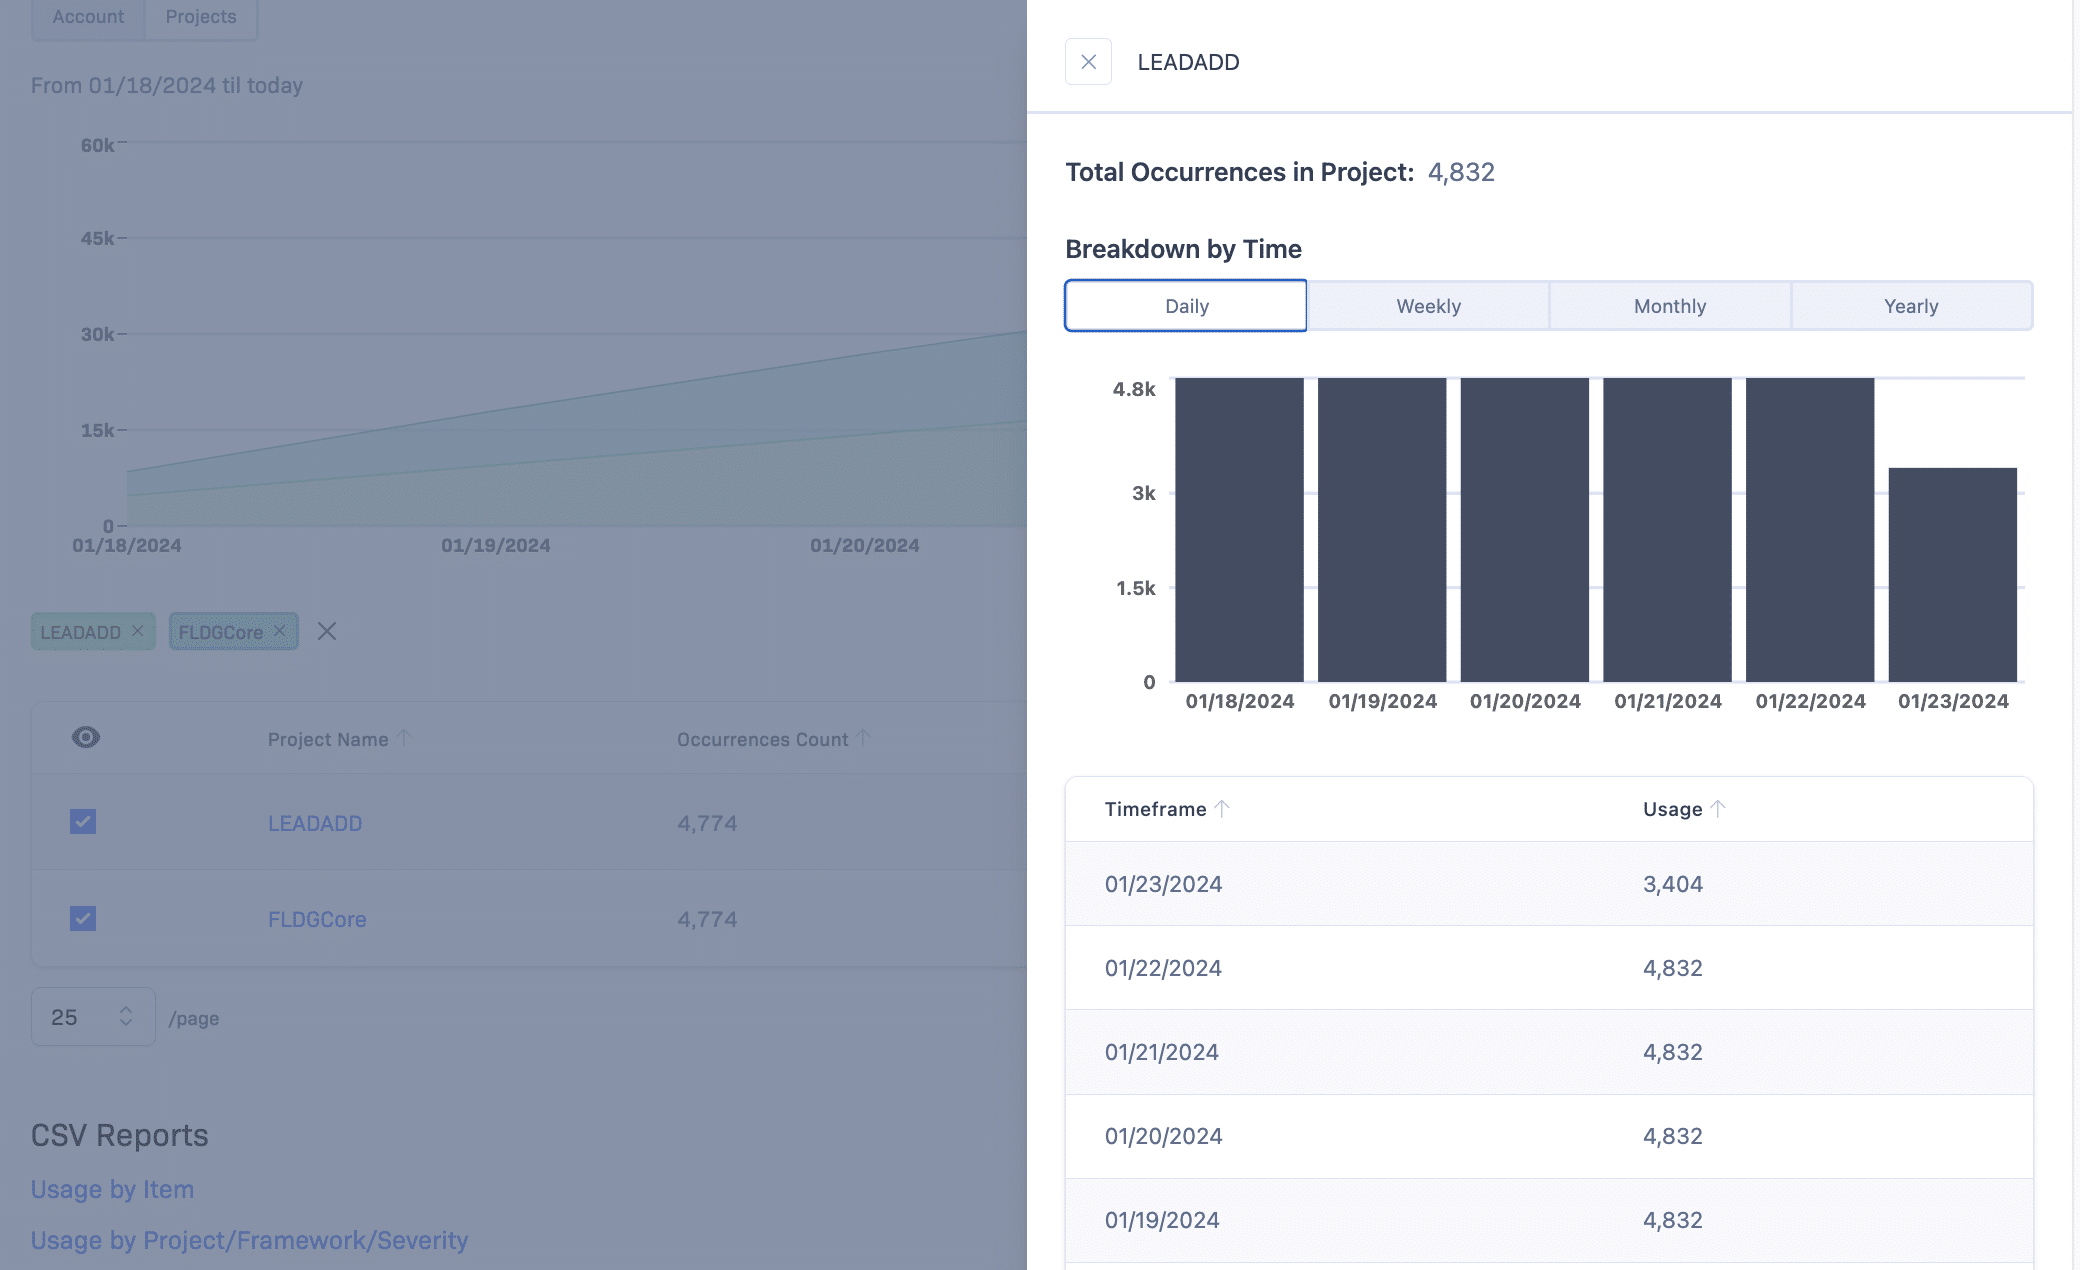
If you need a deep dive into individual projects, clicking on a project title in the projects tab now brings up a slide-over with a new addition: a detailed graph showing the project's usage over the selected time frame. This graph supplements the existing data table, offering a more visual representation of occurrences.
Your Input Drives Our Improvements
We've combined these features in response to user feedback, making the usage page more practical and user-friendly. As we continue to evolve our platform, your feedback remains invaluable. Explore these new features and let us know how they work for you by emailing us at [email protected]. Your insights are crucial in shaping our ongoing efforts to improve and adapt.