Error resolutions on the go
First, our most requested design change. We understand you won’t always be at your laptop, but you want to
manage
your errors and resolve them as quickly as possible. Our new Item Detail page will allow you to check on all
your
errors from any mobile device, no matter where you are. We included easy-to-read views, collapsible panels
to reduce
scrolling, and new slide-over panels to reduce loading times. And we even built a new action panel that
gives you
access to all commands from anywhere on the page.
)
Reduced scrolling
We wanted to ensure you had the most crucial actions at the top of the page and that you could resolve your error as quickly as possible. You’ll always have access to update the error’s status. From muting or unmuting notifications, assigning ownership, or creating tickets, our action header gives you access from anywhere on the page.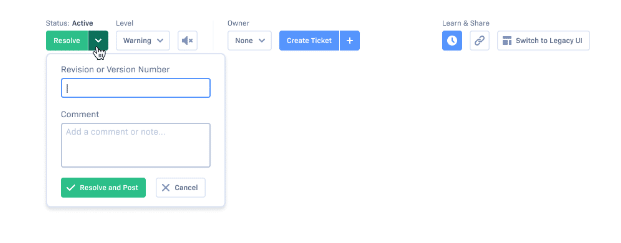
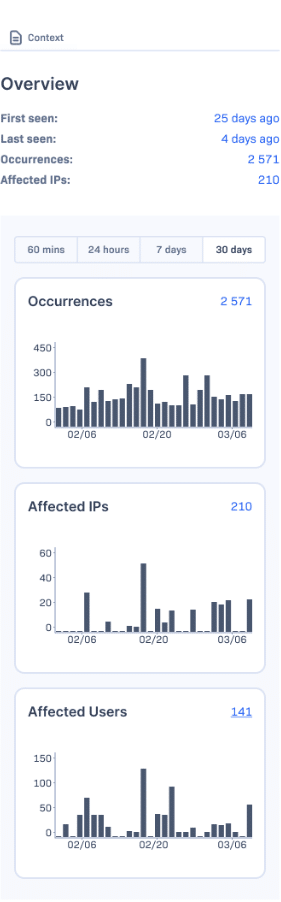
View Item Context details
Our new context panel provides summarized data across all the occurrences within the Item. Now you can get
important
information about how your errors impact your users, their browsers, and how often it has occurred over time.
Future work will build on this to provide further summarization of the data contained within the occurrences of
the
item.
Debug quicker
At the heart of the Item Detail page are the details of an individual occurrence that show what happened to trigger the event. When the Item Detail page is opened, the detail panel shows the data contained in the latest occurrence thrown, with the ability to open specific occurrences if required. The design of the Occurrence section has been updated to present the data contained and the history leading up to the event more clearly so that you can dig into, investigate and understand the Occurrence quickly, and resolve issues faster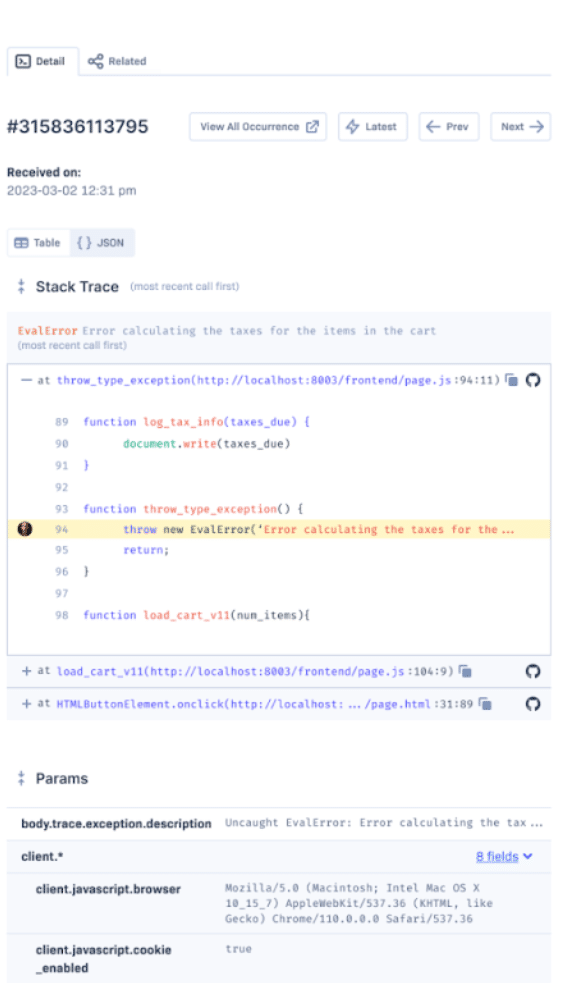
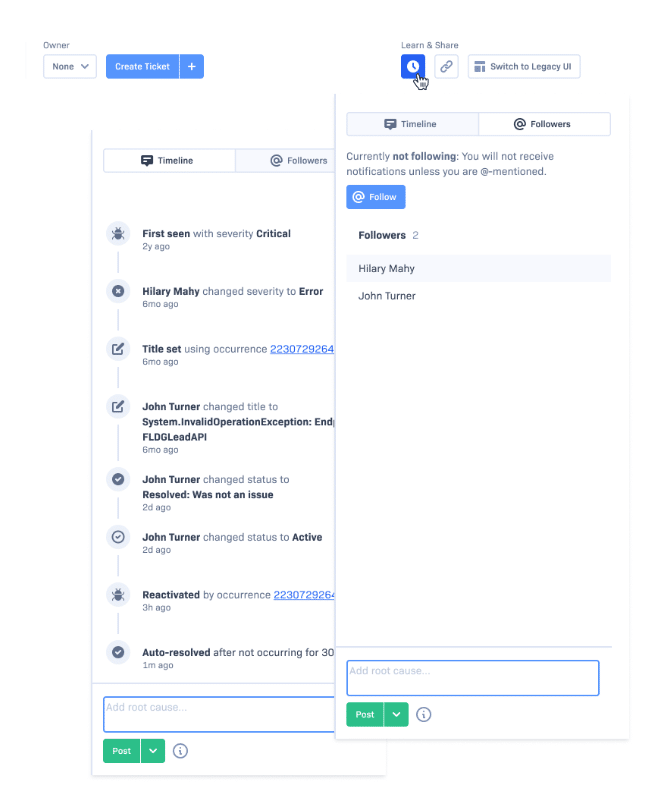
Collaboration where you need it
We have also added a Root Cause & History panel, located on the far right side and visible by default on the desktop view. It provides a timeline of items, related information, collaborators' notes, or status changes. You can get up to speed on the item history, who you need to work with, and the best way to fix your problem.