{: .highlightbox}
Update: As of Aug 1st, 2018 we've made Account Dashboard available to all users, including those on Essentials plans. The Account Dashboard for users in Advanced plans also includes information on deploys and when they took place. As part of this general release, we've removed the Labs label from the Account Dashboard feature.
We are excited to release our new Account Dashboard! The Account Dashboard gives your engineering team insight into errors across multiple Rollbar projects. This insight provides an overview of how each application and service is performing, so you can quickly identify and drill down into problem areas and error trends.
In today’s microservices world, applications consist of multiple services that interact together to deliver the full user experience. There is the client side of the application that the user typically sees, which may be a webpage or mobile app. Behind that, there may be an application server and multiple API services, often owned by separate development teams. This makes the job of monitoring more complex because you need to monitor all the services at once. Errors or a loss of availability in any one service can result in cascading failures to downstream services, and ultimately the user.
Check out what Jason Kozemczak, Tech Lead at Instacart had to say about the Account Dashboard.
The Account Dashboard makes it even easier than before to understand the overall health of the Instacart product as well as individual teams/systems that make up Instacart. It also makes it dead simple to know where our engineering time has the highest leverage regarding issues affecting our customers and shoppers.
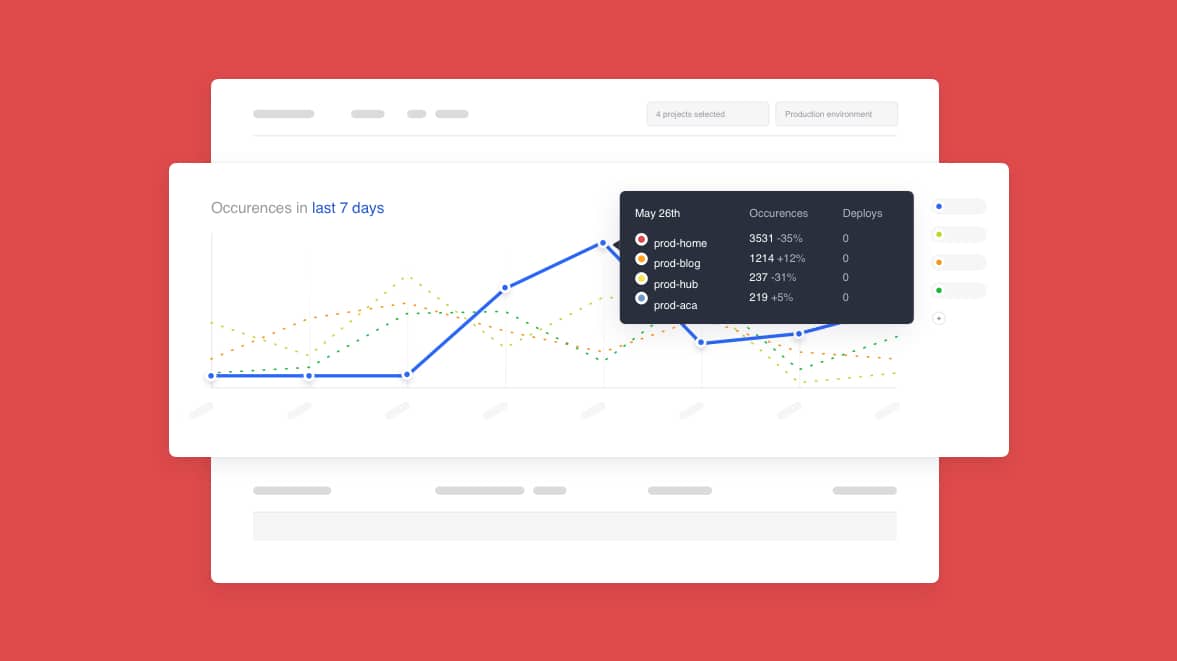
The Account Dashboard displays the number of error occurrences over time for each project. This allows you to see if problems are primarily affecting a single Rollbar project or multiple projects. If two projects display a correlated pattern, they may be related to the same root issue. You can also compare each project to the previous 24 hours to see if there was a recent change, such as after a recent code deployment.
You can narrow down problems by filtering on specific Frameworks, Environments, or error Levels. You can also see more detail on the total number of Occurrences, Activations of new errors, as well as the number of code Deploys made.
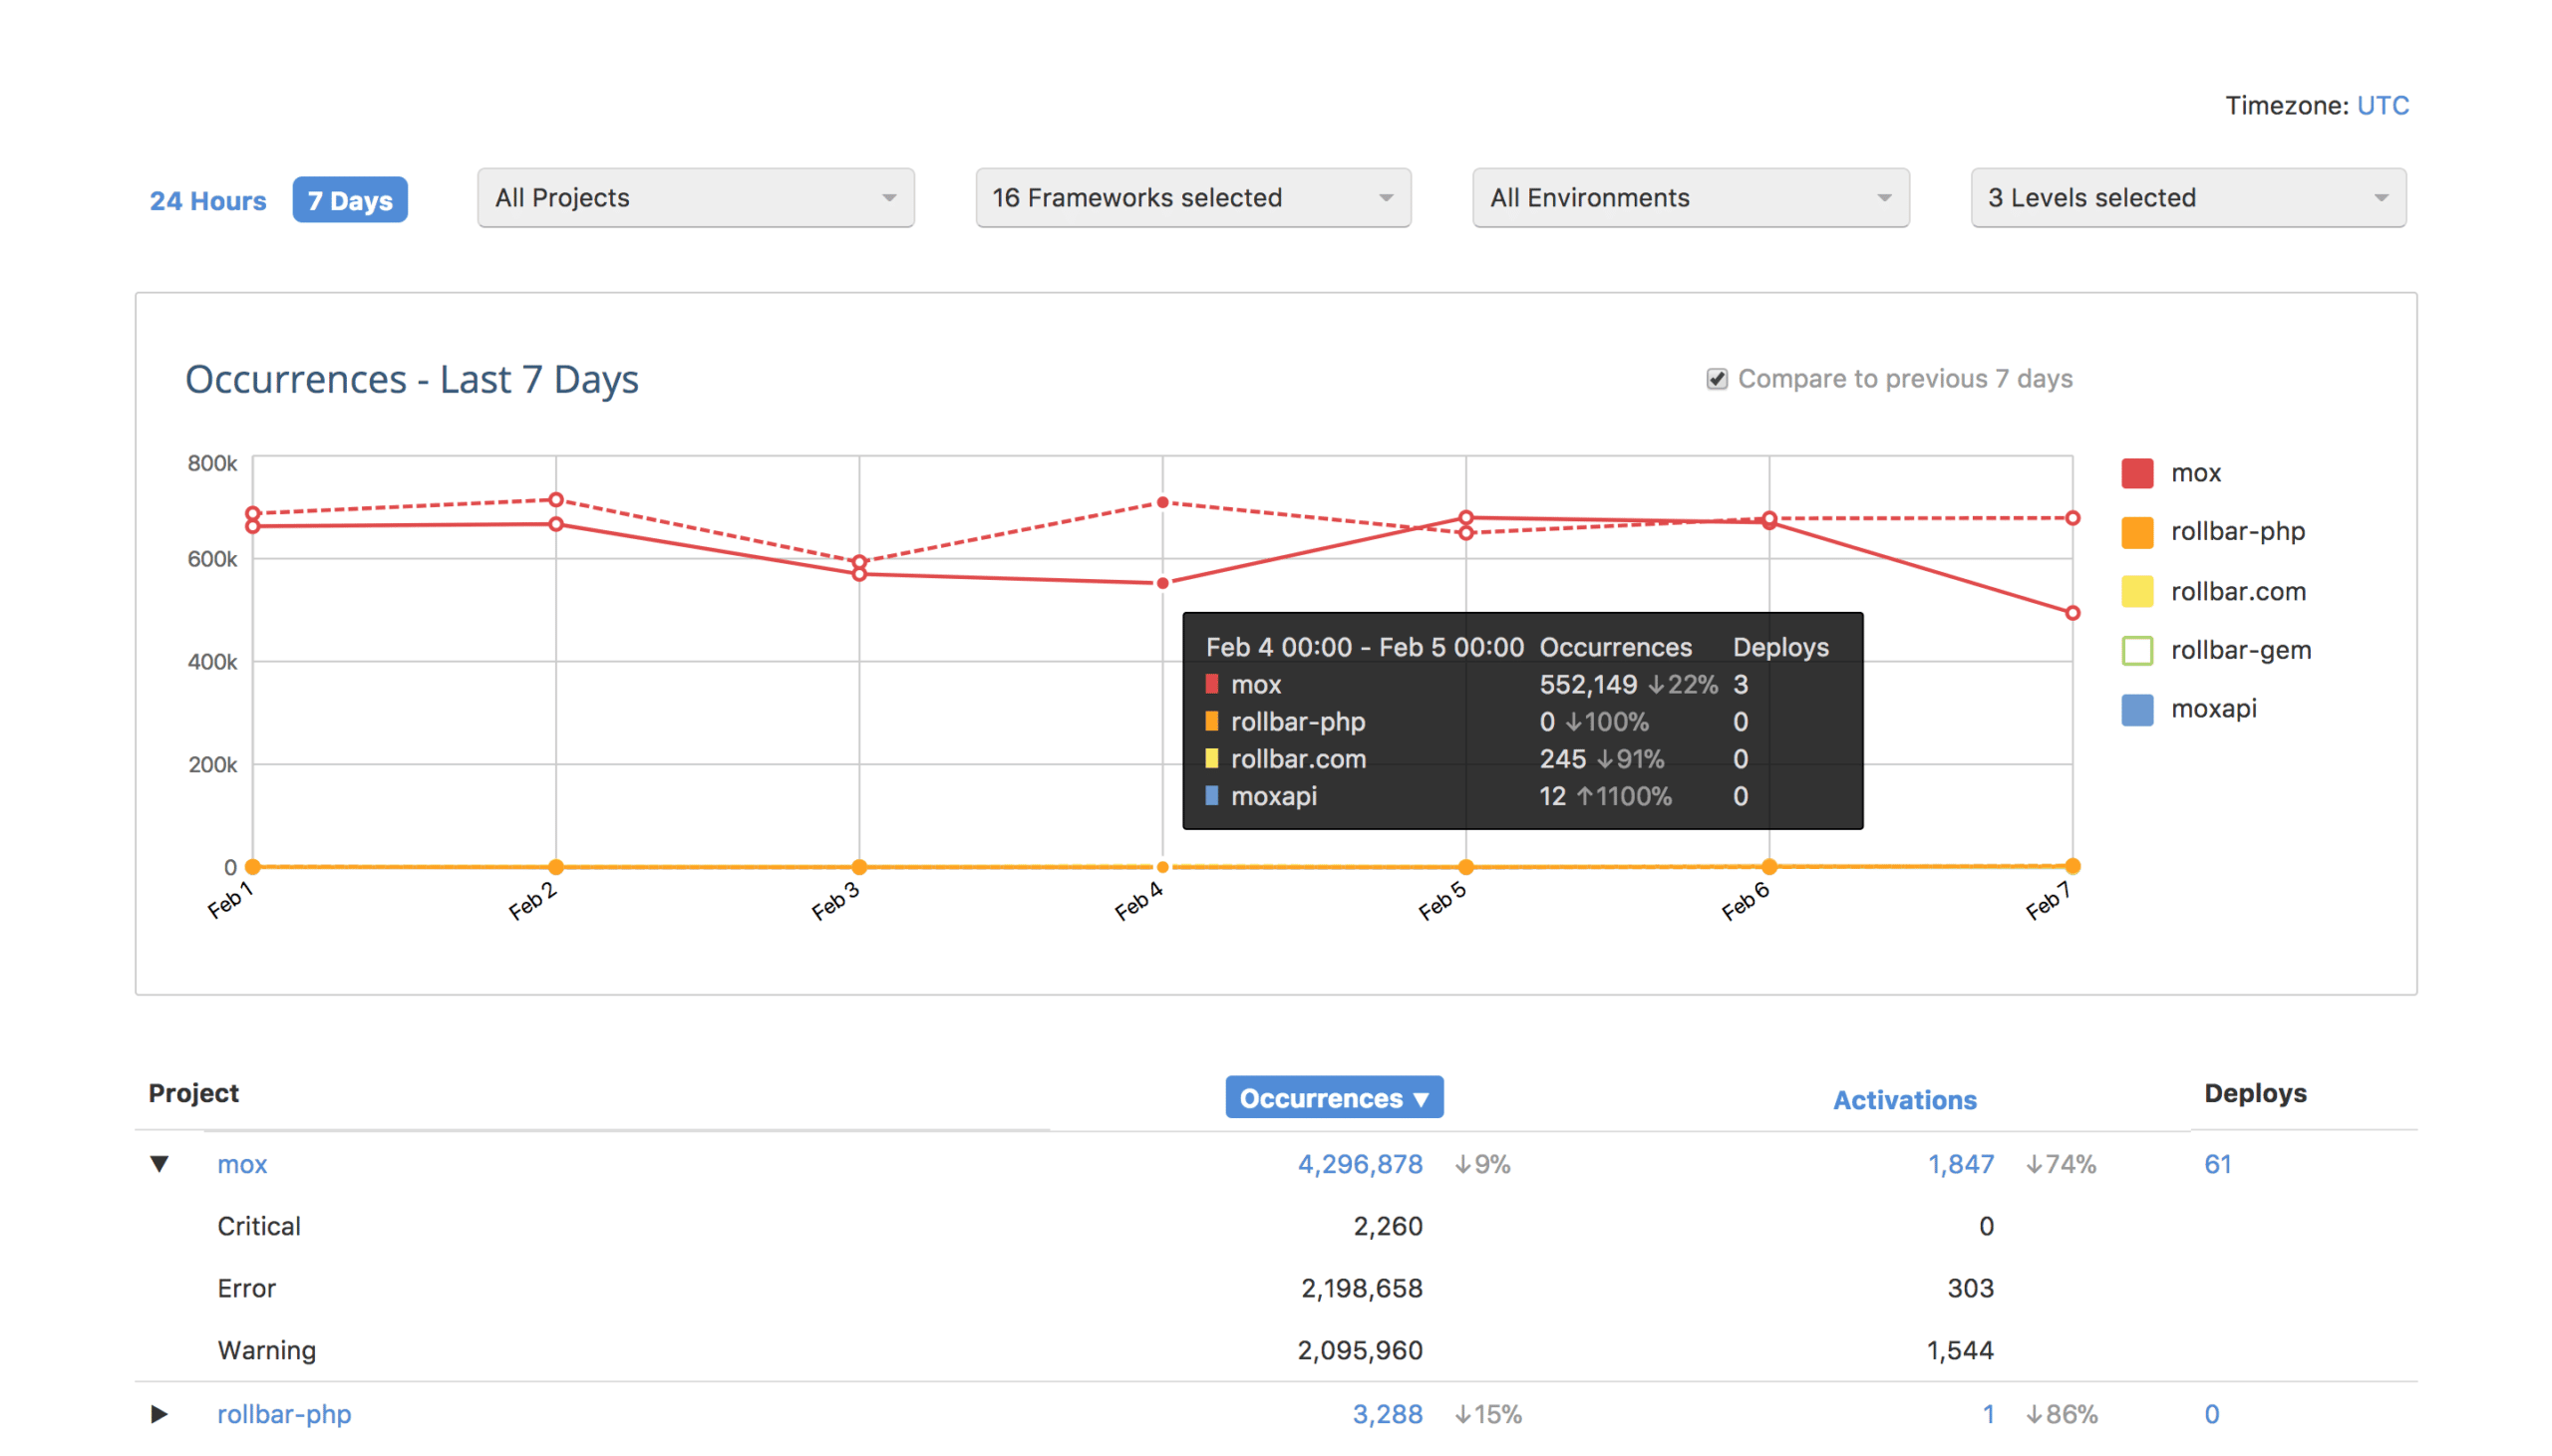
{: .imgcaption}
Account Dashboard, as seen in Rollbar
Account Dashboard is available on the Growth and Premium plans. We hope that you and your team will save time in your day-to-day debugging efforts with the new Account Dashboard. We appreciate your feedback. Email us and let us know what you think.
If you haven’t already, sign up for a 14-day free trial of Rollbar and let us help you
take control of your software application errors.