Node.js has a built-in debugger that you can start in running processes. To do this, send a
SIGUSR1 signal to the running process and connect a debugger. The one, big caveat here is that the
debugger only listens on the local interface, 127.0.0.1.
The following are instructions for debugging Node.js applications running in your company's private
network from your laptop, through a bastion host.
- SSH into the production host that is running the Node.js app
- Put your production app into debug mode.
prod-host $> kill -s SIGUSR1 - As root, start an SSH tunnel to connect your private network with localhost.
prod-host $> ssh -N -q -L :8585:localhost:5858
- Put your production app into debug mode.
- On your laptop
- Start an SSH tunnel to the production host, through your bastion host.
laptop $> ssh -N -q -L 5858::8585 @
- Start an SSH tunnel to the production host, through your bastion host.
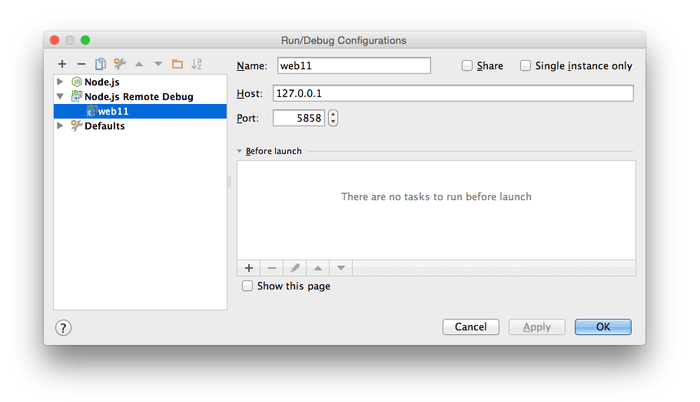
- Open PyCharm and create a remote debugging configuration.
- Run → Edit Configurations
- Click the + button on the top-left of the window and select “Node.js Remote Debug”
- Set the host to
127.0.0.1using port 5858, name it and save.
- Run the new Debug configuration.
- Run → Debug...
- Select the new configuration.
At this point your laptop will have connected to your local SSH tunnel which will be connected to
your production host's private network interface which will be tunneled to your production host's
local network interface and your Node.js process.
PyCharm → local SSH tunnel → bastion host → production host private network → production host
localhost → Node.js
Set some breakpoints in PyCharm and watch as your production process begins waits for you to step
through your app.
Note: If you'd rather use the command line instead of PyCharm just run the node debugger from your
laptop:
laptop $> node debug localhost:5858
Happy debugging!
Troubleshooting
Sometimes PyCharm will just not connect to the running process on your production machine. Try
restarting each of the SSH tunnels.
- Restart the SSH tunnel on the production machine.
- Restart the SSH tunnel on your laptop.
- Restart the PyCharm debugger.
If you haven’t already, signup for a 14-day free trial of Rollbar and let us help you
defeat annoying errors in your applications. 🙂