Take control of monitoring and responding to Errors
We are very lucky on the Rollbar Customer Engineering Team because we get to work with many many development teams. Each team develops, tests, and deploys their applications in their own way. They have chosen different languages and frameworks to solve their particular problem. We learn from each team that we work with, and share these learnings to our Product Design team.
Javascript development teams contact Rollbar because they want to to build a real-time error monitoring and response process primarily for 3 reasons:
- They don’t know what errors their end-users are experiencing
- They want to give their end users a higher quality experience
- They want to find and fix errors in their code efficiently
We see one big difference between Javascript teams we help and teams that develop in other languages:
For applications developed in other languages, the teams generally already has logging and some form of application performance monitoring in place for their Production environment. For Javascript applications, the teams generally have zero visibility into errors that their end users are experiencing.
In some ways this makes perfect sense:
- The browser developer tools make debugging errors in pre-production too easy. Developing formal observability processes for application errors isn’t prioritized early in the life of a Javascript application.
- Client-side errors are typically not the responsibility of SRE teams. Since development teams are so busy, an observability and error monitoring solution just hasn’t been built
- Javascript errors can be noisy and teams don’t realize that they can quickly build a high performing error monitoring solution for their frontend applications
In other ways it makes no sense at all because
- Javascript errors are experienced by end users
- End users perceive the quality of service that they receive in large part based on the quality of the frontend applications they use
When Javascript teams enable Rollbar in their applications they immediately transform their error response process. Within about 15 minutes configuring Rollbar, the team has real-time visibility into:
- The errors that their end users are experiencing
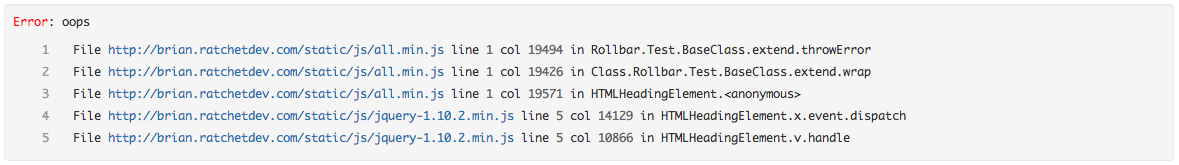
- The full stack trace of the errors
- The number of users impacted by each error
- The code version that introduced the error
Teams particularly like being able to see errors in their application in real-time immediately after releasing a code change.
Teams can fine tune the process to add additional contextual information to errors, easily address noise in the results, and set it up to get notified of important errors immediately
Very quickly teams go from learning about errors when their users contact them, to being able to see production errors in real-time. They can quickly develop and deploy a fix before many users are affected.
If you are struggling to find and fix errors efficiently in your Javascript code, and want to quickly set up an error monitoring solution for your Javascript errors, try Rollbar today It's FREE
Track, Analyze and Manage Errors With Rollbar
Managing errors and exceptions in your code is challenging. It can make deploying production code an unnerving experience. Being able to track, analyze, and manage errors in real-time can help you to proceed with more confidence. Rollbar automates error monitoring and triaging, making fixing JavaScript errors easier than ever. Sign Up Today!