

This is a guest post by Derek Haynes from Scout, an APM that integrates with Rollbar.
When New Relic launched ten years ago, web applications had a tendency to fail hard and in more obvious ways:

Today, it's easier to build resilient apps, but they fail in more complex, unique, and subtle ways. These issues are time-consuming to track down. While several niche New Relic alternatives have appeared, they've focused on a lighter feature set versus solving these increasingly hard performance problems.
What is new relic used for?
New Relic is a Software as a Service offering that focuses on performance and availability monitoring. It uses a standardized Apdex (application performance index) score to set and rate application performance across the environment in a unified manner.
What does new relic do?
New Relic is observability software that teams use it to monitor the performance of their applications and infrastructure.
New relic tracing
New Relic APM provides trace visualizations designed to help you quickly understand why a specific request is slow, where an error originated, and where you can optimize your code to improve the experience for your customers.
Unlike existing "New Relic Lite" alternatives, Scout approaches performance monitoring much like Rollbar's best-of-breed error monitoring. Scout is designed to drastically reducing the investigation time for these complex performance issues.
Let's investigate a modern-day performance issue with Scout and compare the experience to New Relic.
A sudden increase in response time
You hop into Scout and see this chart:
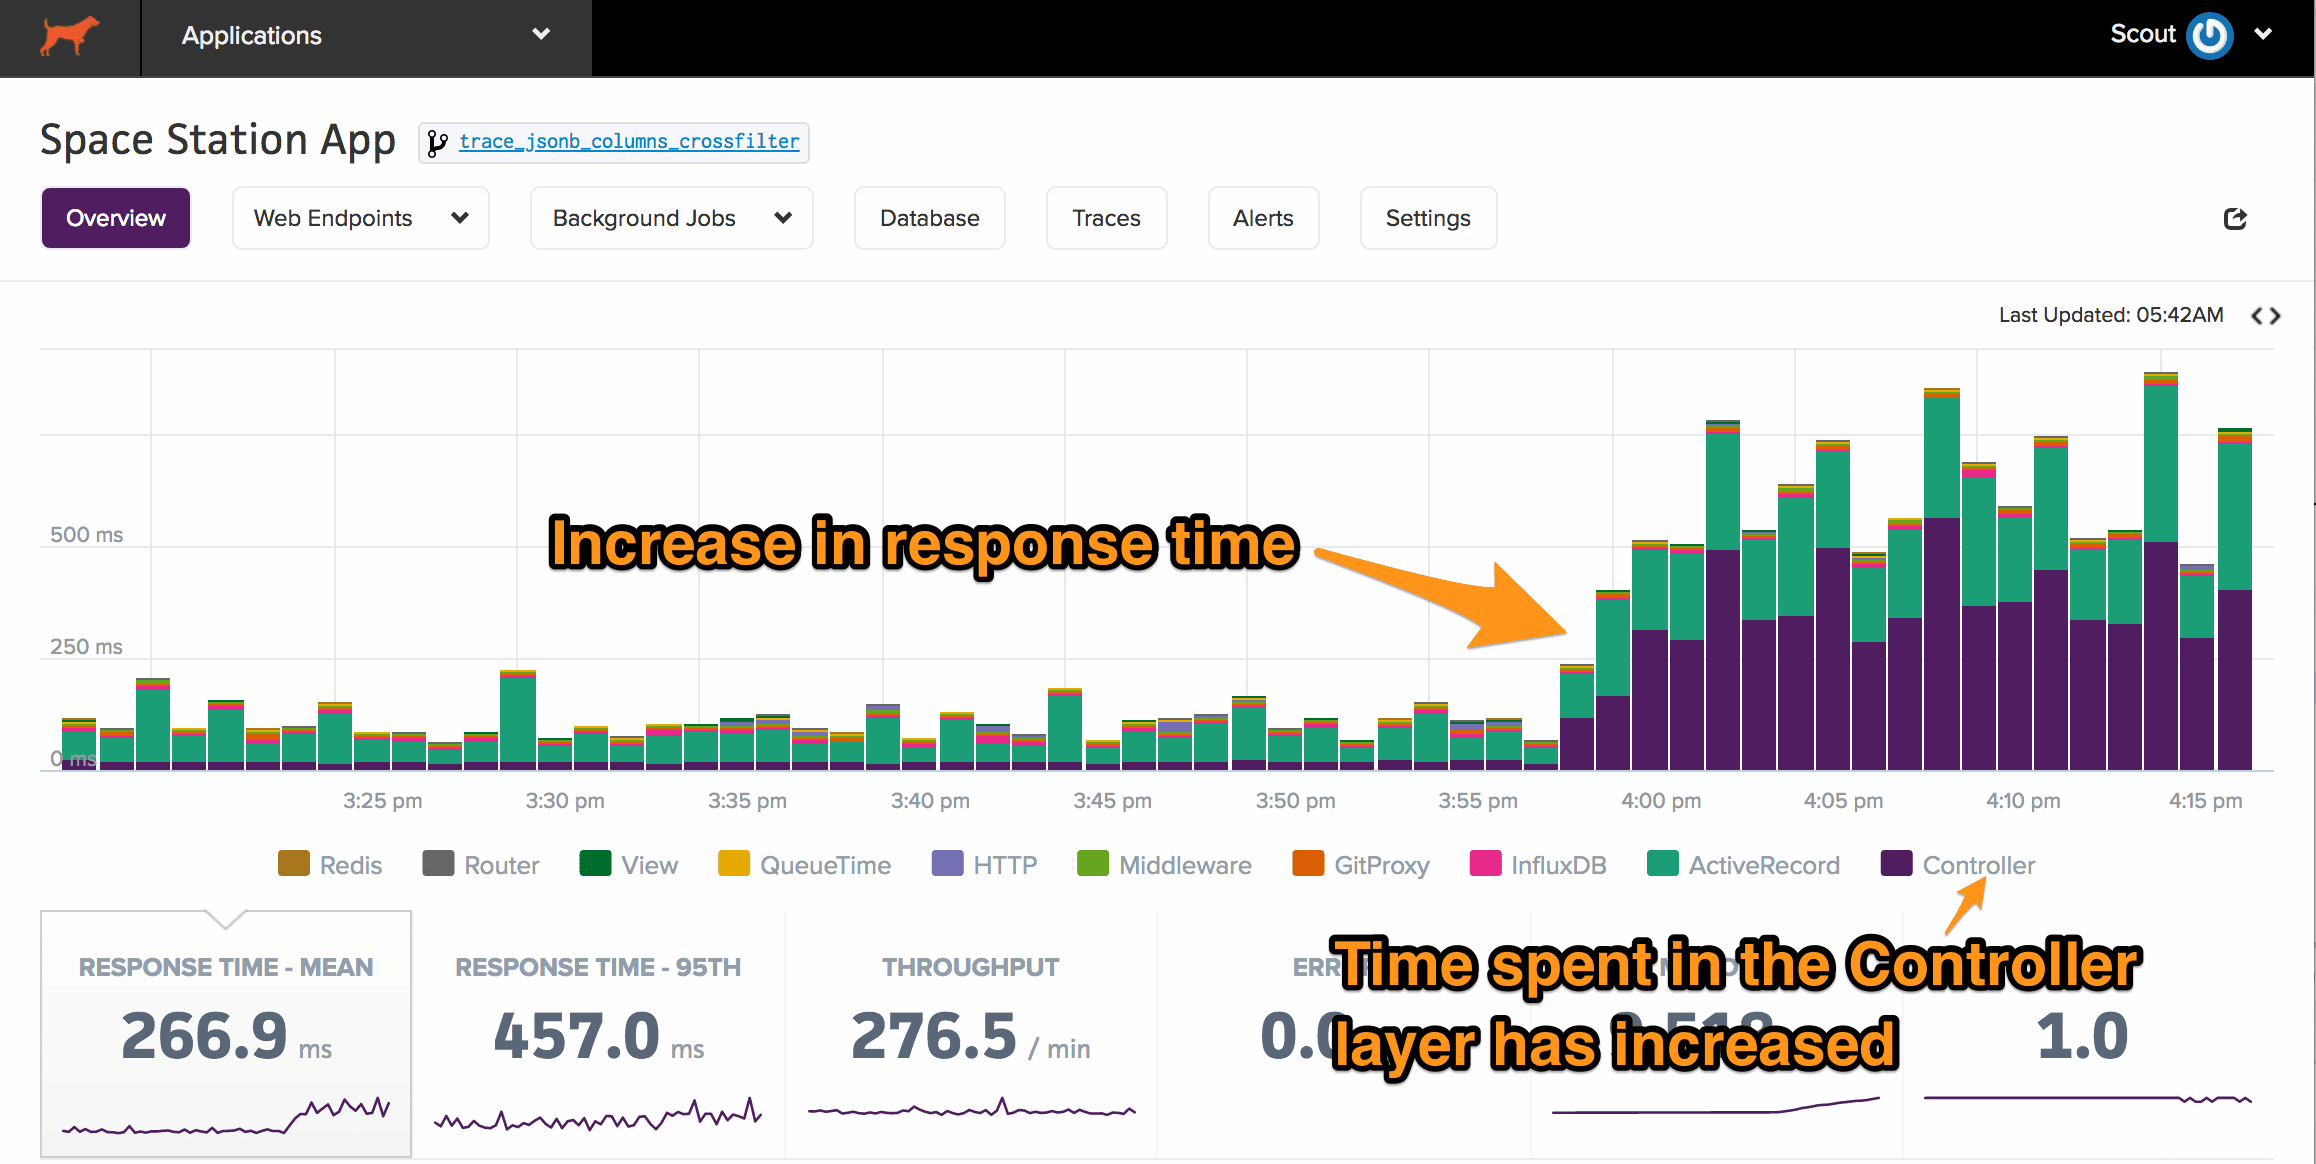
There's a clear increase in overall response time for this Rails app, largely from time spent in the Controller layer. To understand the incident, we need to answer the following:
- Is this isolated to a single web endpoint or across the app?
- What triggered this problem?
- What area of code is responsible for this bottleneck?
- Which developer on our team is best equipped to fix this?
Let's start with the first question.
Is this isolated to a single web endpoint or across the app?
Around 60 endpoints received traffic during this incident. Are response times increasing across many endpoints or just one? In New Relic, you'd need to navigate to the "transactions" area, click on each transaction, and identify which endpoints match the trend. This can be a laborious process.
With Scout there's no need to manually click on dozens - or sometimes hundreds - of different endpoints and inspect charts.
Click-and-drag over the spike in response time to reveal additional details:
Scout analyzes the response time of each endpoint for you, identifying those with the greatest latency over the highlighted timeframe. There's only one endpoint that mirrors the overall response time trend - AlertsController#list.
We've dramatically reduced the time to identify the scope of the impact with Scout. This issue is limited to one endpoint.
What triggered this problem?
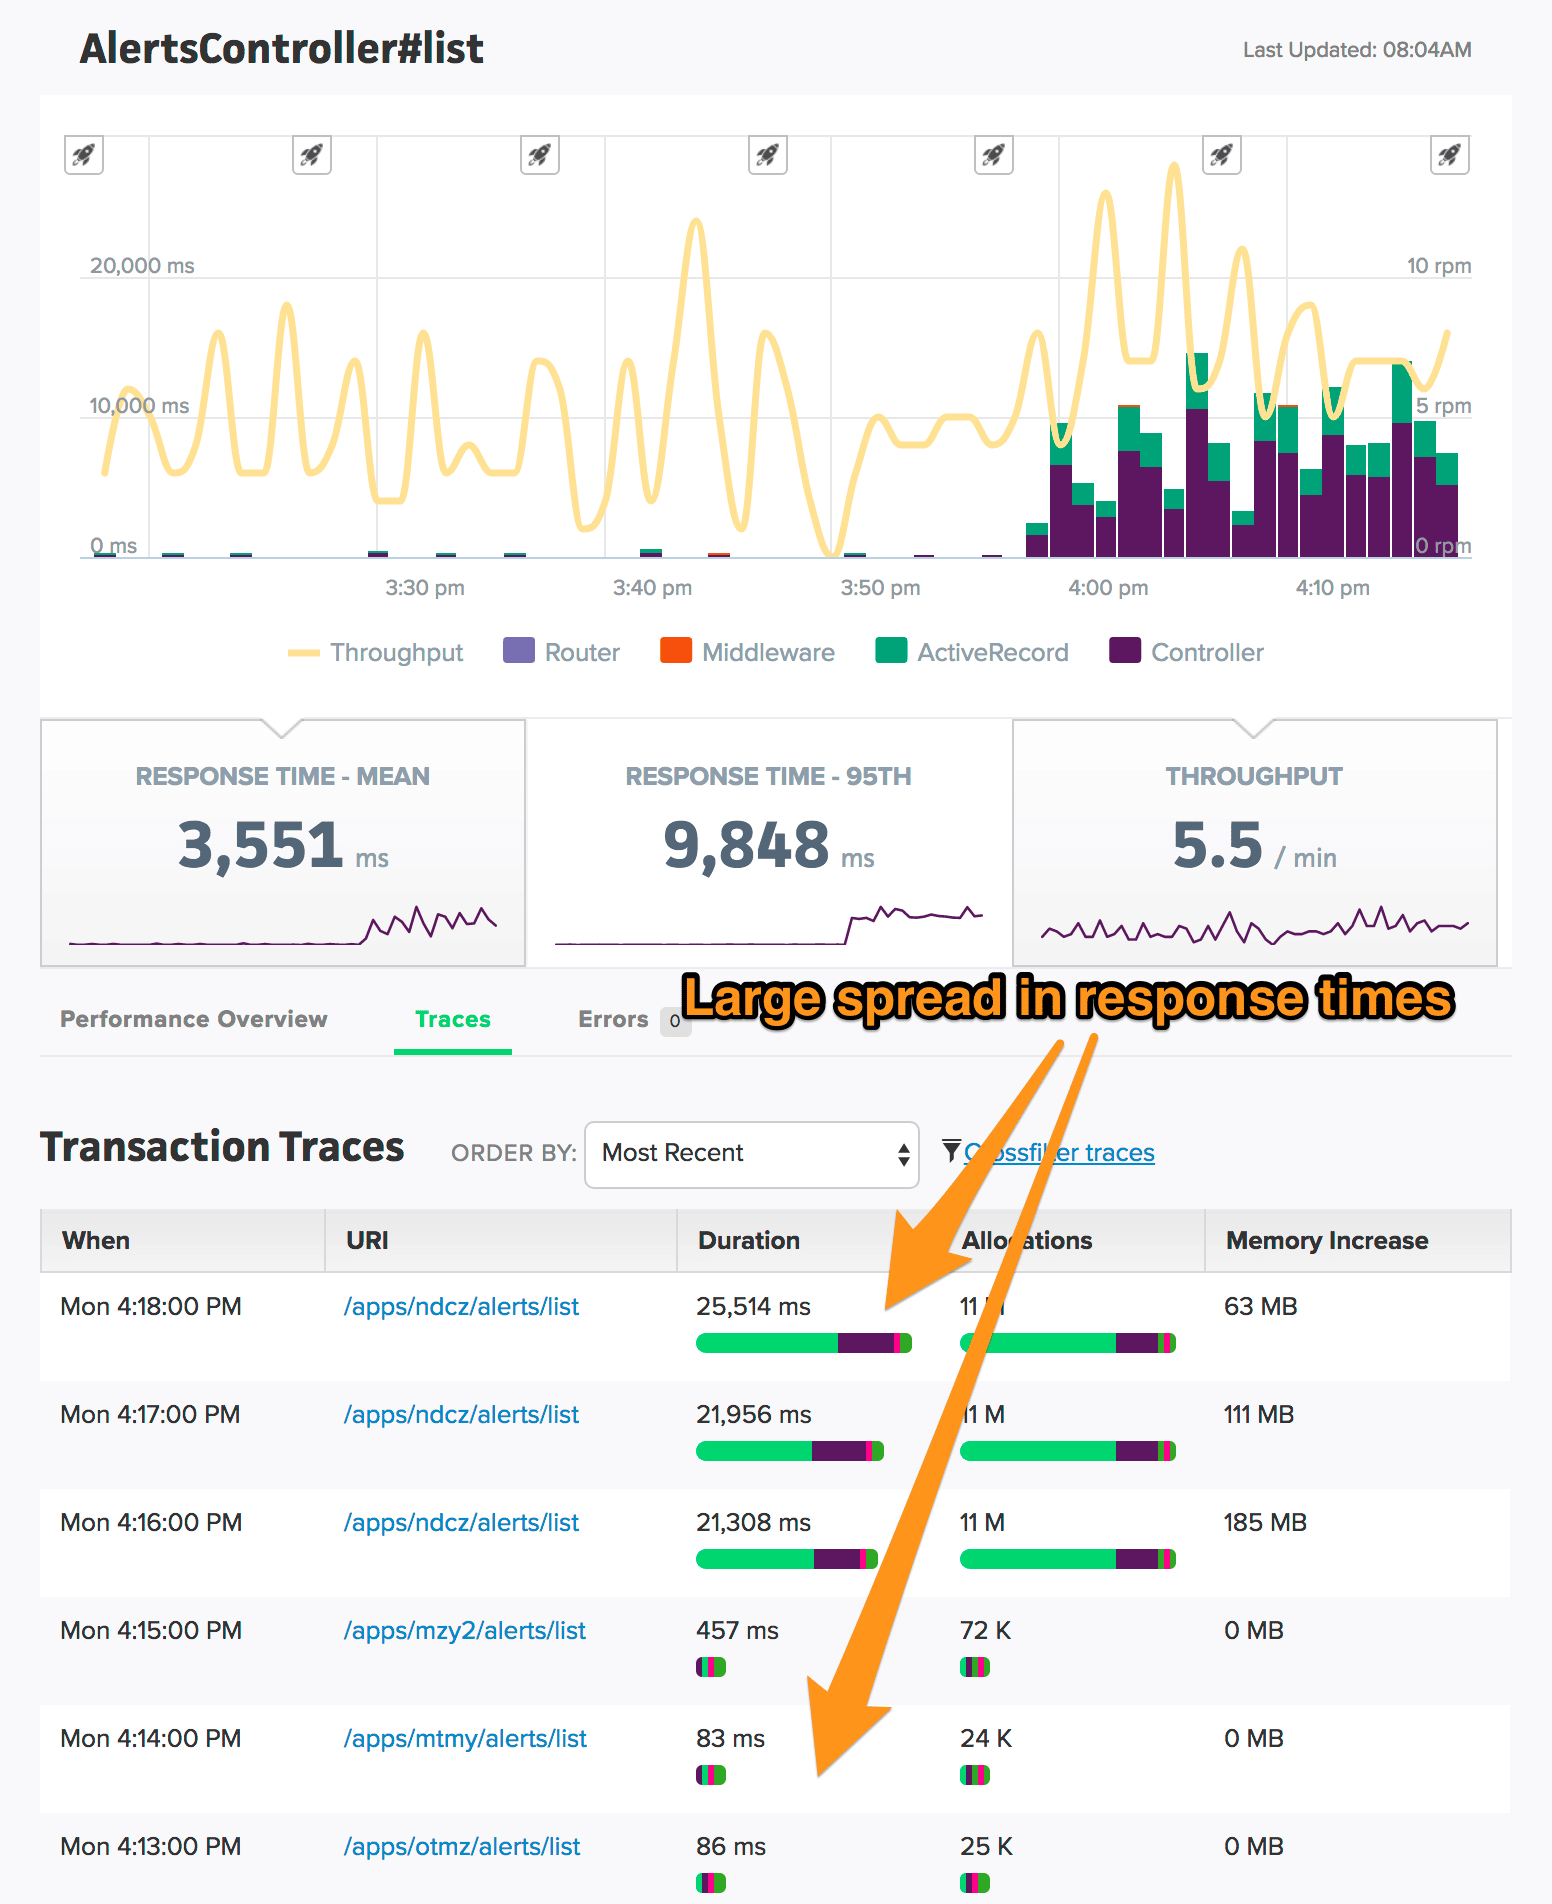
Clicking on the AlertsController#list link, we can see that there's a large spread in the response time of transaction traces collected by Scout:
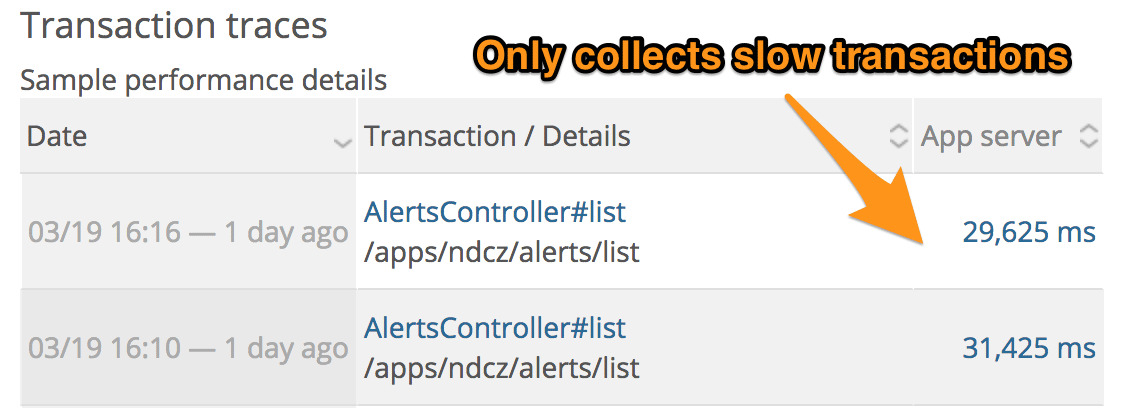
It's harder to identify the dramatic spread in response time with New Relic as only traces for slow requests are captured:
Do these very slow requests share something in common?
We can explore the transaction traces collected by Scout via the Crossfilter feature. This lets us dynamically filter transaction traces across many dimensions (ex: the session's user email, IP, request path, etc). Let's inspect just the slowest AlertsController#list transaction traces:
We can see all of the slow requests are coming from the same request path and user email. We've identified the needle-in-the-haystack conditions triggering the incident. This quick inspection of trace data isn't possible with New Relic.
Now that we know the triggers, what section of the code is the root cause?
What area of code is responsible for this bottleneck?
When you inspect a transaction trace with New Relic, you see this:
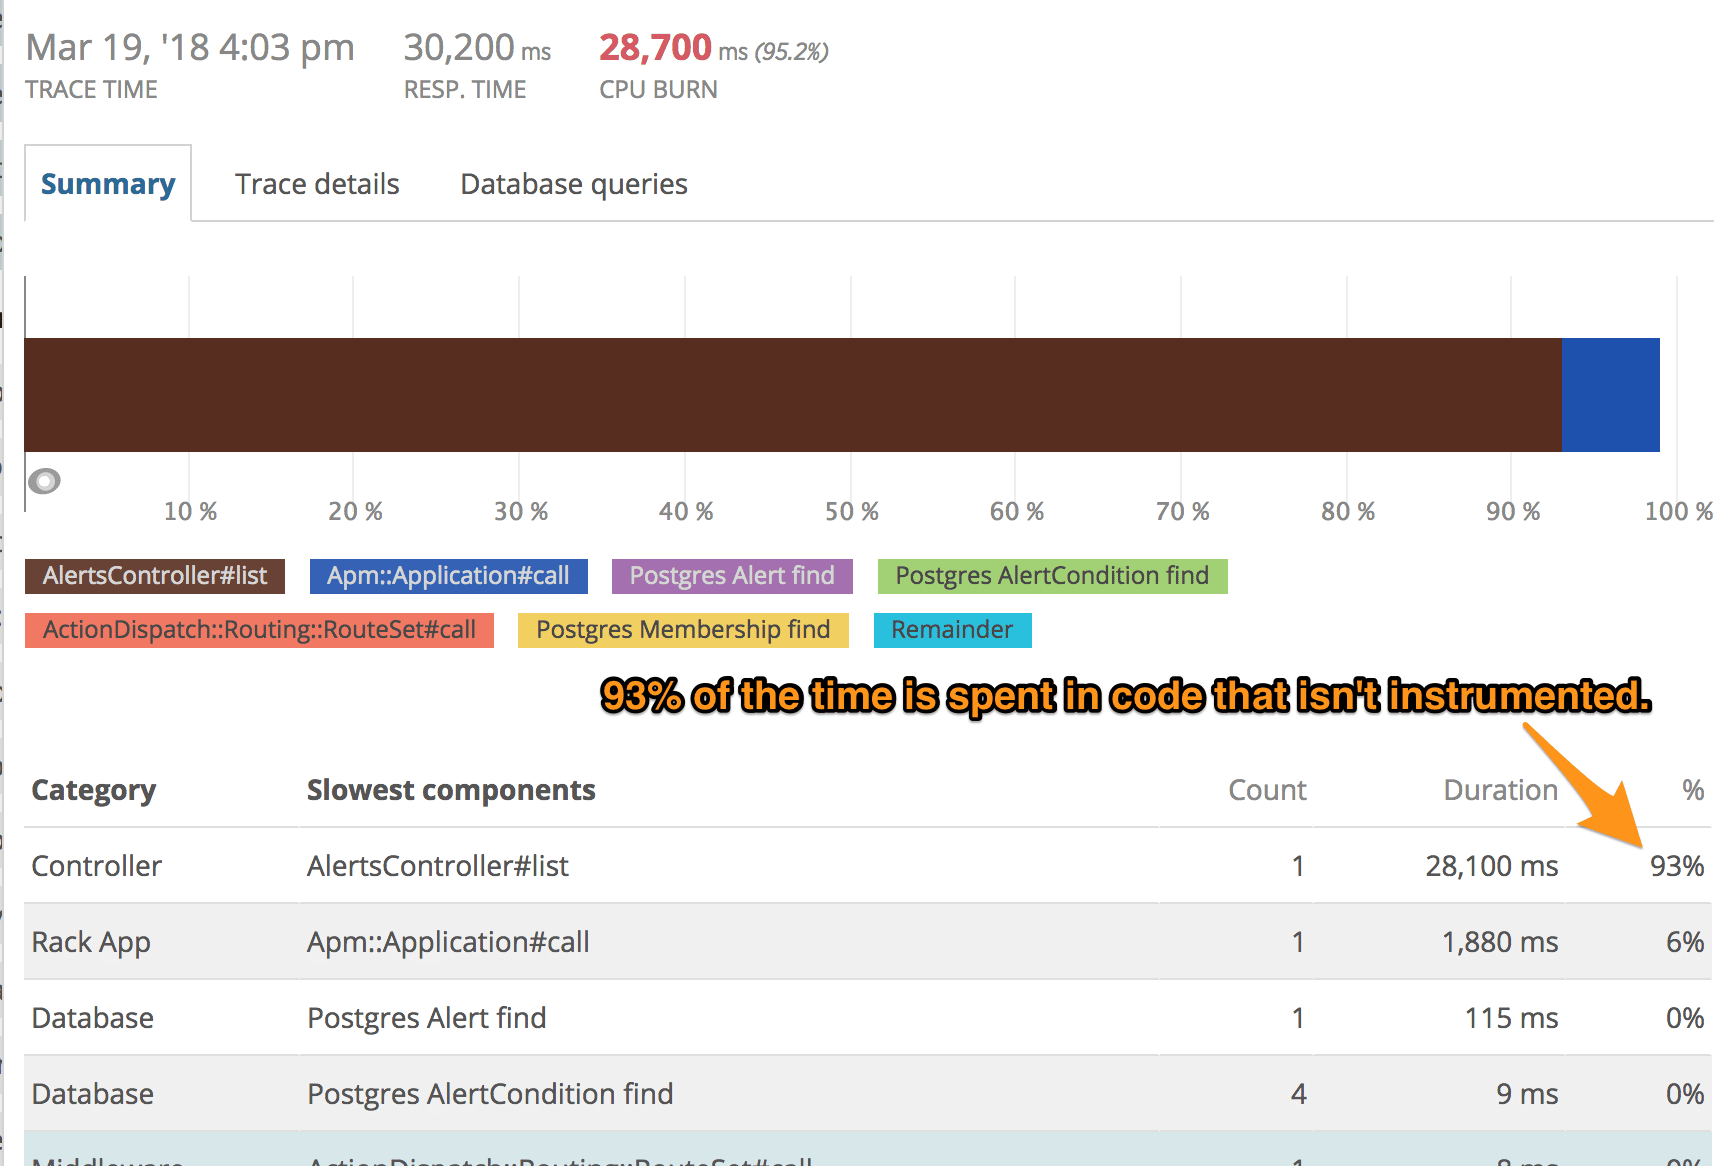
Almost all of the time is spent in your custom code. You could guess where to add custom instrumentation, but that's a long process with a slow feedback loop. Local profiling may not help if you don't have the ability to reproduce the production dataset.
With Scout, you gain visibility into your application code without custom instrumentation. ScoutProf, a production-safe profiler, automatically analyzes your custom code:
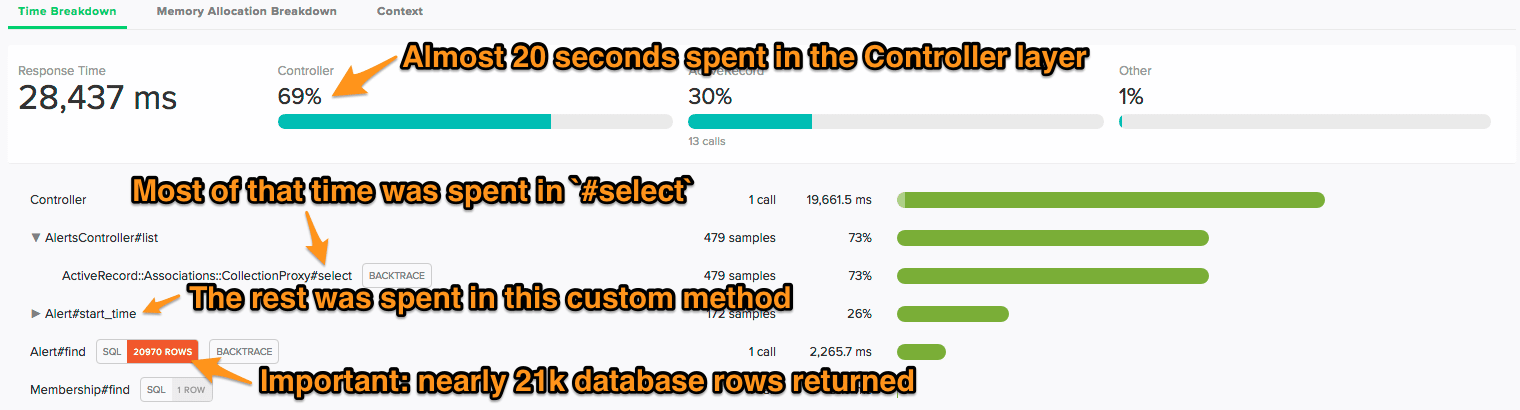
ScoutProf identified two Ruby bottlenecks. Additionally, Scout identified a database query that returned nearly 21k rows (this information isn't available in New Relic).
We're almost there. Your team is composed of several developers. You aren't familiar with this code and are unlikely to be efficient at addressing this issue.
Which developer on our team is best equipped to fix this?
Scout integrates with GitHub, overlaying git blame output on top of application code. With that, we can identify the developer who most likely knows about this bottleneck:
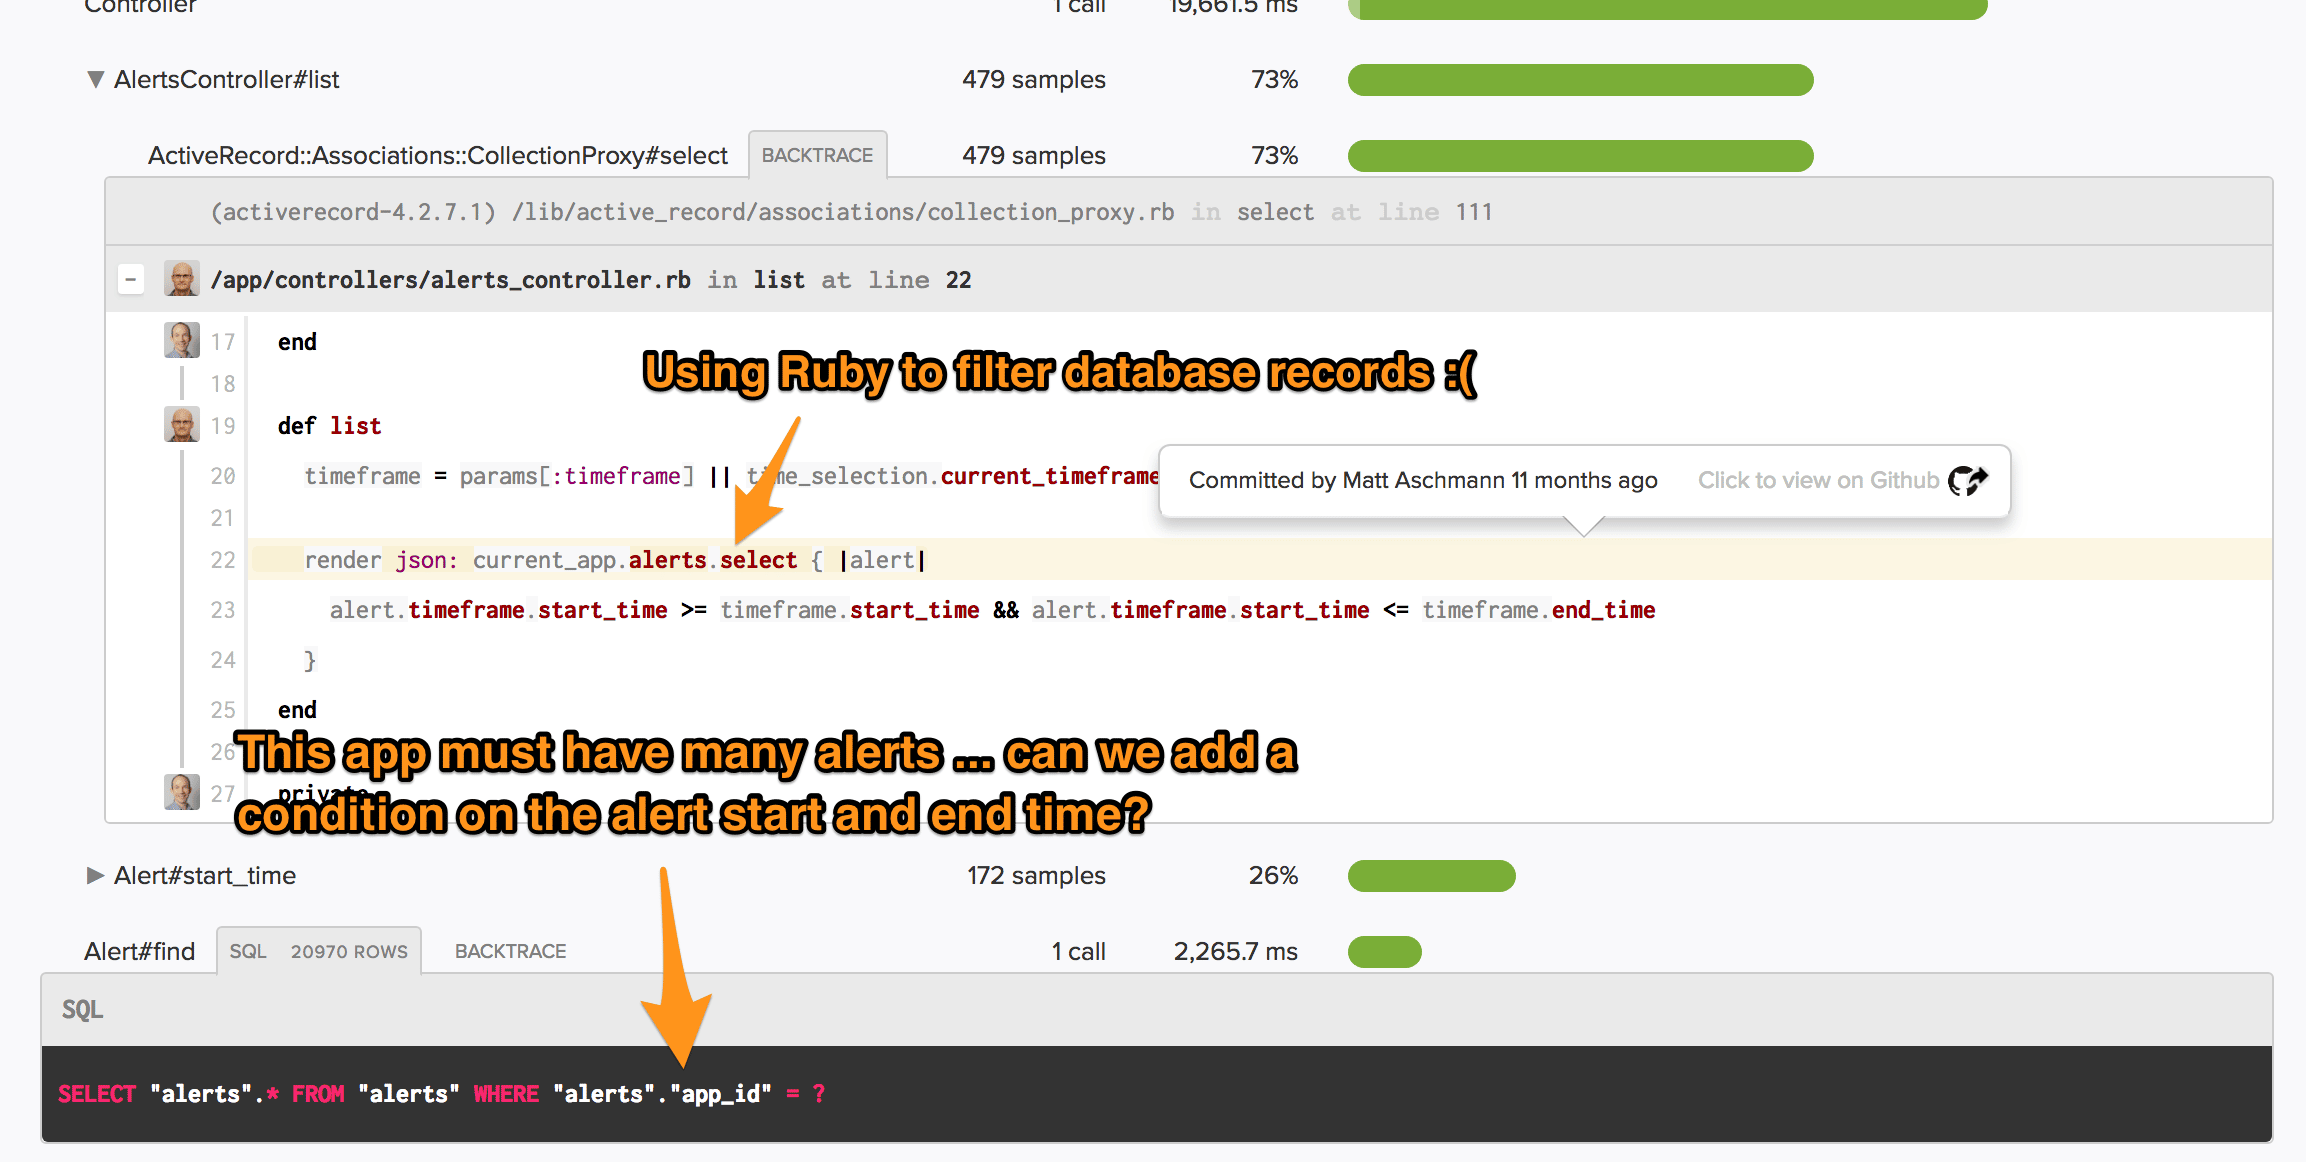
It looks like we're seeing these very slow request because current_app has far more alerts than other apps. Since we're using Ruby to filter database rows, this is slow. The solution? Move the filtering conditions to the SQL query.
Language support?
Scout supports a growing number of languages. Today, Scout has performance monitoring agents for Ruby / Rails, Python, and Elixir.
Pricing?
In most cases, Scout is more affordable than New Relic. You can easily tune the volume of data you send to Scout for analysis by sampling or ignoring some transactions.
TL;DR
New Relic was built in the time of large-scale, major outages. Scout takes Rollbar's best-of-breed approach to today's softer, but harder to investigate performance issues.
Resources
If you haven’t already, sign up for a 14-day free trial of Rollbar and stop flying blind in production.