The infrastructure behind most modern web applications includes an assortment of tools for collecting server and application metrics, logging events, aggregating logs, and providing alerts. Most systems are made up of a collection of best-in-class tools and services, selected and deployed over time as team members arrive and depart, needs change, the system grows, and new tools are introduced. One of the challenges web development and operations teams face is collecting and analyzing data from these disparate sources and systems and then piecing together what’s happening by looking at multiple reports and dashboards.
Two common pieces in this puzzle are Logstash and Rollbar.
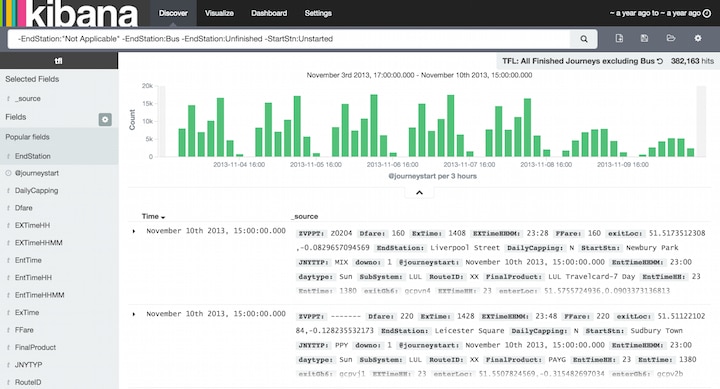
Logstash (and the Kibana web interface, both of which are heavily supported by and integrated with Elasticsearch) lets you collect and parse logs, store them in a central location, search and explore the data via the Kibana UI, and output events to other services. Logstash provides a powerful tool for taking logs in many different formats, converting them into JSON events, then routing and storing those events.
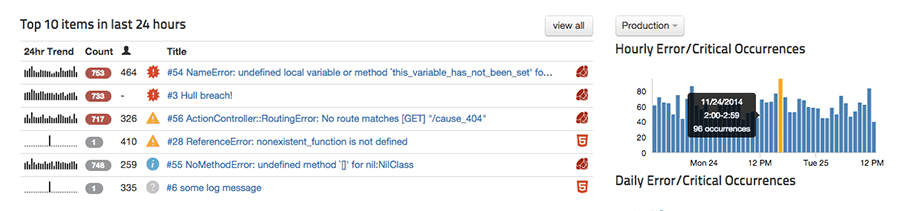
Rollbar collects errors from your application, notifies you of those errors, and analyzes them so you can more efficiently debug and fix them. With a few lines of code or config changes to your application, you can make errors, complete stack traces, trends and affected user reports accessible via your Roller dashboard. Like Logstash, Rollbar collects and analyzes events represented in JSON.
By connecting Logstash and Rollbar, you can not only centralize and analyze your system and application logs, but also improve error tracking and simplify debugging by providing context to developers looking at errors generated by their code.
Most Logstash users have tried to configure Logstash to parse multi-line exception messages, or have tried to convince a development team to adopt standards for application debugging and error message. For code your team controls, it’s likely much simpler to install the Rollbar notifier for the language and framework you’re using. You can send errors from your Ruby,
Python, or PHP application or browser JavaScript to Rollbar and the service will parse stack traces automatically and update your dashboard in real time. You can see the values of local variables when the error occurred, and these errors are associated with other errors of the
same type.
For Rollbar users, Logstash allows you to collect errors from external applications and ship them to Rollbar, where they'll appear on the same dashboard as your application errors. Database and web server errors, for example, can be passed along to Rollbar to help developers determine whether the error is due to a bug, database performance issue, or operational issue with the web server.
To get started...
- If you're Logstash user who'd like to get started with Rollbar, you can sign up for a free account.
- If you're a Rollbar user who'd like to try Logstash, see "Getting Started with Logstash"
- For instructions on configuring Logstash events to Rollbar, see "How to Integrate Logstash with Rollbar".