Why are Airbrake users switching to Rollbar?
We're seeing quite a few former Airbrake users switch to Rollbar. Why are they doing that? We're glad you asked...
This article will cover a few key areas where we think Rollbar differentiates. It's kind of long, so feel free to skim. There's also a big comparison table at the end.
We aren't regular Airbrake users ourselves, but a frequent refrain we see on Twitter and hear in conversations has been disatisfaction with Airbrake's uptime and site speed. We've taken this to heart and done a lot of work to make Rollbar reliable and fast. We're not perfect, but we're proud of the work we've done and it's paying off.
Our team has built systems at scale (50M users, 200+ servers) before and we're applying what we've learned to make Rollbar rock-solid. Here are a few things to note:
The key to our current snappiness is in keeping everything in memory. The primary databases are each beefy boxes with 208gb RAM and terabytes of SSDs. Raw occurrence data is stored on regular disks and fronted by memcache.
If you have more questions about our infrastructure, please email us at team@rollbar.com. We're happy to answer questions and we'll share that knowledge here.
Rollbar was built from the ground up to support general-purpose logging as well as the common special case of exception logging. This means:
Want to record a non-exception warning condition, like not being able to connect to an external API? Rollbar.warning("Could not connect to Acme API.", :some_data => @its_value)
. Have an exception that you want to keep an eye on, but isn't really an error? Mark it as a Warning in the interface.
If you're familiar with logging frameworks, you'll feel right at home here. We use this ourselves for everything from logging business events ("user logged in") to form validation errors to slow queries.
Want to find exceptions that occurred in a particular file? In a date range? Warnings on a particular host? That contain the word "hello"? Rollbar can do all of this and more.
The search index is updated in real-time and runs on the fantastic Sphinx Search.
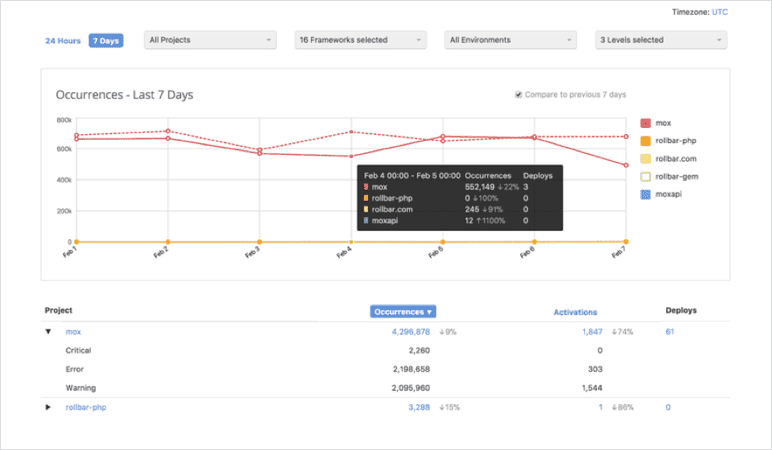
Debugging complex issues is often about finding patterns, and often the best way to see that is visually. The Rollbar dashboard includes graphs of occurrence and new item counts, with deploys overlayed (so you can see how deploys affect error rates). There are also inline graphs (sparklines) showing the rates of each individual item on the Dashboard and Search pages.
On the Item Detail page, there are graphs of occurrence counts by hour and day (again with deploys overlayed), a table of you can scan for patterns, and graphs showing the Browser and OS breakdowns.
If an error happened on a GET request, we have a Replay button that will re-run the same request (URL, headers, cookies and all) so you can instantly reproduce it.
Airbrake has the basics here (recording which user was affected by a particular error), but Rollbar takes it to the next level. You can see the history of events seen by each user, as well as a list of all your users we have any data for.
One customer we know of is using this for debugging complex JavaScript issues—they use Rollbar.debug
to log debug messages, and then view the results in the Rollbar interface.
You can set up notification rules for any of our supported channels (see the list in the table below), filtered by environment, severity level, string match on the exception class+message, and string match on any of the filenames in the traceback.
If you were looking for a big comparison table, this is for you:
Rollbar | Airbrake | |
---|---|---|
Basics | ||
Hosting provider | Google Cloud | AWS |
Data model | Exceptions and log messages | Exceptions only |
SSL | ✓ | Paid plans only |
Pricing model | Per-occurrence; optional rate limit | Pick a rate limit |
On-premises available | ✓ | ❌ |
Rate limits | Configurable per access token | Set by plan |
Users | Unlimited | Varies by plan |
Projects | Unlimited | Varies by plan |
Teams | Unlimited | ❌ |
Official Libraries | ||
Ruby / Rails | ✓ | ✓ |
Python / Django | ✓ | ❌ |
PHP | ✓ | ❌ |
Node.js | ✓ | ❌ |
JavaScript | ✓ | ✓ |
Flash | ✓ | ❌ |
iOS | Beta | ✓ |
Android | Beta | ✓ |
Managing Errors | ||
Severity levels | ✓ | ❌ |
Auto-resolve old items | ✓ | ❌ |
"Resolved" state | ✓ | ✓ |
"Muted" state | ✓ | ❌ |
Batch actions (set status, level) | ✓ | ✓ |
Resolve from the item list | ✓ | ❌ |
Finding Errors | ||
Dashboard with reports and graphs | ✓ | ❌ |
Search by status | ✓ | ✓ |
Search by date, level | ✓ | ❌ |
Search by title, hostname, context | ✓ | ❌ |
Daily summary emails | ✓ | ❌ |
Understanding Errors | ||
Affected user counts | ✓ | ❌ |
Graphs of rate over time | ✓ | ❌ |
Browser and OS graphs | ✓ | ❌ |
Table of occurrences by parameter | ✓ | ❌ |
Basic person tracking | ✓ | ✓ |
History by person | ✓ | ❌ |
Replay button | ✓ | ❌ |
Non-project code optionally hidden in stack traces | ✓ | ✓ |
Collaboration | ||
Comments on items | ✓ | ✓ |
@-mentions in comments | ✓ | ❌ |
Deploy Tracking | ||
Record when you've deployed | ✓ | ✓ |
Auto-resolve items on deploy | ✓ | ✓ |
History of deploys and commits in each | ✓ | ❌ |
GitHub Integration | ||
Link from stack traces to file in GitHub | ✓ | ✓ |
Available GitHub sign-in and project sync | ✓✓ | ❌ |
Deploy history includes code commits | ✓ | ❌ |
"Suspect Deploy" analysis | ✓ | ❌ |
Notification Channels | ||
✓ | ✓ | |
Asana | ✓ | ❌ |
Campfire | ✓ | ✓ |
Flowdock | ✓ | ✓ |
GitHub Issues | ✓ | ✓ |
HipChat | ✓ | ✓ |
Lighthouse | ❌ | ✓ |
Jira | ✓ | ✓ |
PagerDuty | ✓ | ❌ |
Pivotal Tracker | ✓ | ✓ |
Slack | ✓ | ❌ |
Sprintly | ✓ | ❌ |
Trello | ✓✓ | ❌ |
Webhook | ✓ | ✓ |
Miscellaneous | ||
Free trial | ✓ | ✓ |
Team-based permissions | ✓ | ❌ |
RSS feed | ❌ | ✓ |
We tried to be as unbiased as possible, but if any of the above is inaccurate, please let us know: team@rollbar.com