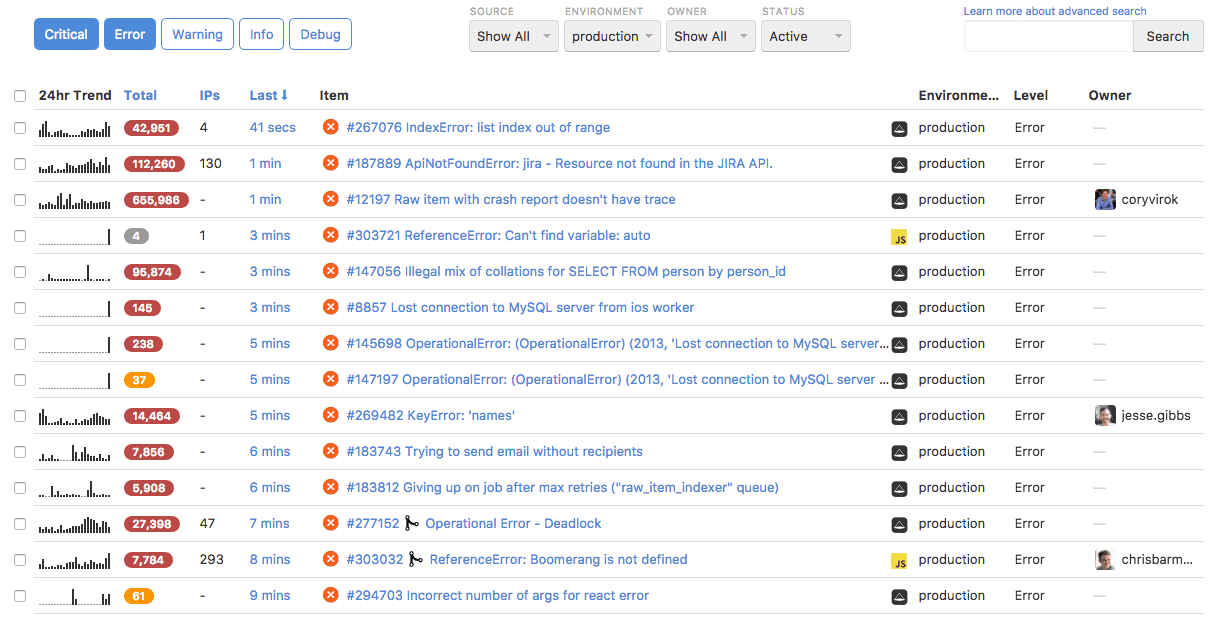
New Relic tells you what's slow, Rollbar tells you what's broken.
Rollbar is specifically designed for real-time error monitoring. Rollbar enhances tools like New Relic that are primarily designed for monitoring transactions and hosts. DevOps teams working in continuous delivery model use Rollbar to reduce and mitigate deploy risk.
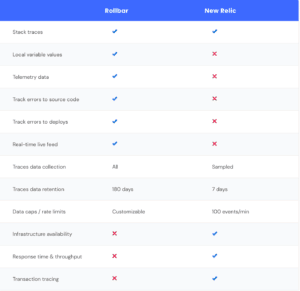
Rollbar | New Relic | |
---|---|---|
Stack traces | ||
Local variable values | ||
Telemetry data | ||
Track errors to source code | ||
Track errors to deploys | ||
Real-time live feed | ||
Traces data collection | All | Sampled |
Traces data retention | 180 days | 7 days |
Data caps / rate limits | Customizable | 100 events/min |
Infrastructure availability | ||
Response time & throughput | ||
Transaction tracing |
* Comparing out-of-the-box features
Rollbar's easier to dive deep into individual incidents. I can find script errors a user experienced and correlate that to systemic problems. Huge win!Eric Wood Engineer
Rollbar is my DevOps insurance policy. They provide me peace of mind about the stability of hundreds of apps and billions of requests.Ethan Kennerly Senior Engineer
A lot of things can happen—and problems can get obscured—when you rely on one minute granularity.
Use the Rollbar live feed to detect errors and exceptions in real-time. This is especially useful immediately after deploys.
Learn MoreRollbar keeps a history of your deploys, commits, and undeployed changes. For each error, Rollbar automatically identifies the suspect deploy, that caused the issue. Quickly view the diff in your source code repository from here.
Learn MoreInstantly get to the line of code in your source repository that generated the error, directly from the stack trace.
Rollbar integrates with popular git repositories, such as GitHub, Bitbucket, and Gitlab.
Learn MoreSee the values of local variables in each method directly in the error stack trace. Replay requests with the exact same parameters to easily reproduce troublesome errors.
Learn MoreGet a timeline of events in the browser leading up to when an error occurred, including user behavior, network activity, console messages, and more.
Learn MoreMerge similar and duplicate errors and create your own JSON-based custom rules to automatically group like error occurrences, so you can focus on what’s important.
Learn MoreNew Relic caps the number of error events collected per agent at 100 per minute, due to performance concerns. Rollbar users can set their own rate limits on how many events should be sent to Rollbar per customizable time window, such as per minute or week.
Traces data are retained for only up to 7 days in New Relic, unless the user specifically views the trace in the product UI. Rollbar retains all your data for 180 days so you can address errors on your own schedule. Custom retention period is available in the Enterprise plan.
New Relic is a host-centric performance monitoring tool and is priced accordingly – on a per host agent basis. Rollbar is an app-centric error monitoring tool, so it is priced by error events. We offer pricing plans that include generous amount of events per month.