Today's applications are incredibly intricate and interconnected, often relying on numerous third-party services and libraries. With this complexity comes an increased likelihood of things going wrong.
However, an error doesn't usually announce itself with great fanfare and a detailed explanation. More often than not, it shows up as an unexplained crash, a suspicious slowdown, or a surprising output.
Error logging shines a spotlight on these problems.
Error logging is a mechanism for capturing and recording errors or issues that occur in your application, providing a crucial lifeline during the debugging process. Think of it like having surveillance cameras in every corner of your application. These logs provide a wealth of information, from the nature of the error and where it occurred, to the state of the system when it happened. This data can be the difference between solving a problem in minutes and struggling with it for days.
While the specifics of logging errors may vary based on the application and the environment, this beginner’s guide will illuminate the universal principles that underpin this crucial development practice. We'll delve into what you should include in an error log, where to save these logs, and how to use logs as your secret weapon in the debugging process.
What to Include in an Error Log
Error logging is a technique that transcends specific programming languages or environments. Whether you're working with Python, Java, JavaScript, or other languages, there are always key pieces of information that should be included in every error log to make it as useful as possible:
- Timestamp: The exact date and time the event occurred. A precise timestamp can help developers understand the sequence of events leading up to an error and can also aid in correlating events across different systems.
- Source: Where the error occurred. This could be the name of the application, the server, the module, or the function where the error was logged.
- Level: The severity of the log entry. Common levels include debug, info, warning, error, and fatal. Understanding the level of the log helps prioritize debugging efforts.
- Message: Descriptive text that provides details about the event. For an error, this could include the exception message or other details about the issue.
- Context: Additional data that can help in diagnosing the issue. This can include details about the state of the application or system at the time the error occurred, such as variable values, system status, or user actions.
Once you have determined what information to log, the next step is to decide how to format it. While the specific format can vary based on your application's needs and the tools you're using, it's essential to maintain consistency. A consistent log format makes it easier to parse logs automatically and to spot anomalies.
A common log format includes the timestamp, level, source, and message, all separated by a specific delimiter, like a comma or a pipe symbol. For instance:
2023-06-14 10:15:23, INFO, LoginModule, User successfully logged in, UserID=1234, IP=192.168.1.1
The context information (in this case, UserID and IP) is often included as key-value pairs to make it easier to extract specific pieces of data.
While the specifics of error logging can vary, including the right information and maintaining a consistent format are universally essential practices.
Where to Save Error Logs
Where to store your logs is a pivotal choice with far-reaching implications. Let's look at the pros and cons of three common approaches: logging to a file, logging to a database, and logging to a remote service.
Logging to a File
Pros:
- Simplicity: Logging to a file is straightforward and doesn't require specialized tools or services. Nearly every programming language has built-in capabilities for writing to a file.
- Performance: Writing logs to a file is usually faster than writing to a database or a remote service, as it doesn't require network communication or complex data operations.
- Control: You have complete control over the logs, including their format, location, and retention policy.
Cons:
- Scalability: As your application grows, so does the volume of logs. Managing large log files can be challenging and can consume significant disk space.
- Analysis: Files do not support complex querying or analysis out of the box. You'll need to use external tools for log parsing and analysis.
Logging to a Database
Pros:
- Searchability: Databases allow for quick and complex querying. This can be invaluable when you need to filter, sort, or analyze your logs.
- Structure: Databases inherently enforce a structure on the stored data, ensuring consistency across all log entries.
- Integration: Many applications already use a database, which can simplify integration and maintenance.
Cons:
- Performance: Writing logs to a database can be slower than writing to a file, particularly if the database is not optimized for this type of workload.
- Complexity: Setting up and maintaining a database for logs can be more complex and resource-intensive than simply writing to a file.
- Risk of Failure: If the database becomes unavailable, logs can be lost. While the same is true of writing to a file, this risk can be mitigated with appropriate backup and failover strategies, but these add additional complexity.
Logging to a Remote Service
Pros:
- Centralization: Remote logging services can collect logs from multiple applications or servers, making them ideal for distributed systems or microservices architectures.
- Advanced Features: Many remote logging services provide powerful features such as real-time monitoring, alerts, dashboards, and ML-driven insights.
- Scalability: These services are designed to handle large volumes of logs, offloading the storage and management concerns from your application. You can be sure they backup everything.
Cons:
- Dependency: You rely on the availability and performance of the remote service. If the service goes down, you might lose logs or face delays in logging.
- Cost: While many services offer free tiers, costs can rise with increased usage. It's important to understand the pricing model and monitor usage to avoid surprises.
- Data Security: Sending logs to a remote service often means transmitting potentially sensitive data outside your network, which can have data security implications. Look for a service that has a strict security and compliance policy.
How to Debug Using Error Logs
After you’ve identified an error, check the logs to understand its source and context. Whether it's a specific module, function, or service can help you understand where to start looking in your code. The state of the application or system when the error occurred can help you understand the circumstances that led to the error.
Next, try to reproduce the error, ideally in a controlled environment like a testing environment. This can provide additional insights and help confirm whether the error is consistently reproducible or sporadic. This might involve going through the code line by line or using a debugger tool to step through the code. If your application interacts with other services or systems, the timestamp can help you correlate events across different systems.
Once you understand the cause of the error, apply a fix. This might involve modifying your code, changing configuration settings, updating dependencies, or even filing a bug report with a third-party provider.
Verify that your fix resolves the error by reproducing the original conditions that led to it. Ensure that the fix doesn't introduce new issues. And, of course, after deploying your fix, continue to monitor your logs to ensure the error doesn't reoccur.
Track, Analyze and Manage Errors With Rollbar
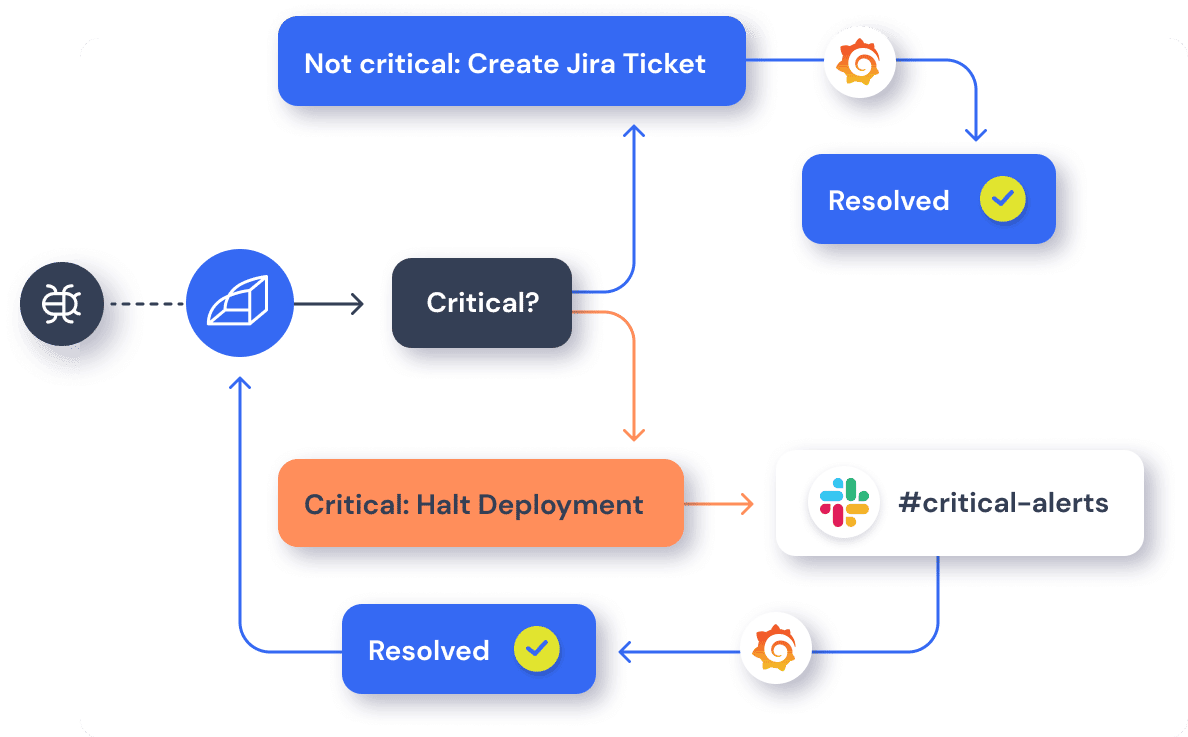
Error logs are a valuable resource, but managing errors and exceptions in your code is challenging. Don’t get stuck digging through logs or creating queries and filters just to find the problem. Track, analyze, and manage errors in real-time with Rollbar. Rollbar takes immediate action on new and reactivated errors before they impact users with AI-assisted workflows that automatically create tickets for any new or critical error in tools like Jira and assign them to the right person immediately. Try it today!
Further Reading
Error logs are a valuable resource and we’ve put together several guides on how to leverage them effectively in your debugging efforts: