How to capture performance issues with Rollbar
Rollbar allows you to gain real-time visibility into exceptions and crashes in your applications and act on them quickly and easily. An important piece of any application is knowing if transactions are executing slower or below a certain threshold. Rollbar provides an easy method to send this data to be processed quickly and easily inside your existing Rollbar project.
First we need to understand what data and metrics we need to capture to help understand slow responses and understand the root cause of these. Let’s take a look at a Python application where we want to track slow responses as a Rollbar item.
Here is what we recommend to ensure an easy way to use this data:
-
We recommend sending events as warnings/errors based on thresholds.
- For example, "Request over 10s: project/index".
- Send the detailed timing information as a custom parameter.
- Include your standard Rollbar metadata like request, server, person, custom, etc.
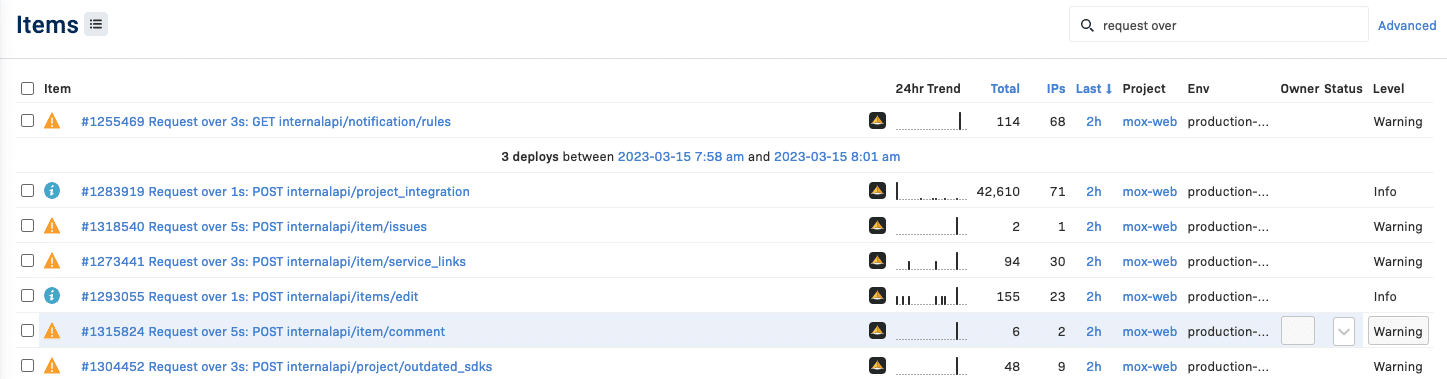
How will this performance data look inside Rollbar?
Below is an example of API calls that have been logged in Rollbar where the request was over the set threshold (set in seconds).
Python code to capture slow requests
Let’s create the functions to help capture and log these slow transactions in our Python application.
Sample Python code for a context manager to report slow code paths:
import time
import rollbar
import logging

log = logging.getLogger(__name__)

class ReportIfSlow(object):
    default_thresholds = {
        'error': 30,
        'warning': 10,
        'info': 2
    }

    def __init__(self, message, thresholds=None, **rollbar_params):
        self.message = message
        self.rollbar_params = rollbar_params
        self.time_elapsed = None

        self.thresholds = self._make_thresholds(thresholds)

    def _make_thresholds(self, thresholds):
        thresholds = thresholds or self.default_thresholds

        return sorted(thresholds.items(),
                      key=lambda x: x[1],
                      reverse=True)

    def __enter__(self):
        self.start_time = time.time()

    def __exit__(self, exc_type, exc_value, traceback):
        self.time_elapsed = time.time() - self.start_time
        for level, value in self.thresholds:
            if self.time_elapsed >= value:
                message = '%s (%s)' % (self.message, level)
                extra = self.rollbar_params.setdefault('extra_data', {})
                extra['time_elapsed'] = self.time_elapsed

                rollbar.report_message(message, level, **self.rollbar_params)
                break

with ReportIfSlow("name_of_operation", extra_data={'foo': foo}):
    do_operation(foo)
Using the Python function in a Pyramid application
Now that we have the ability to understand if a transaction is slow or not, we can implement and use this inside our Pyramid application to capture and log these slow requests to Rollbar.
Example Python code to instrument a Pyramid application to capture these slow requests:
import hashlib
import logging
import time

import rollbar

from mox.lib import profiler
from mox.lib.helpers.urls import stat_route

log = logging.getLogger(__name__)

'# slowness thresholds in descending order
'# 0-1: debug (ignored)
'# 1-3: info (logged at 'info' level)
'# etc.

SLOWNESS_THRESHOLDS = [
    ('warning', 10),
    ('warning', 5),
    ('warning', 3),
    ('info', 1),
]

def factory(handler, registry):
    "Simple tween that measures response times, sends response time to StatsD, and reports slow requests to Rollbar."

    def profiler_tween(request):
        try:
            start_time = time.time()
            return handler(request)
        finally:
            end_time = time.time()
            elapsed = end_time - start_time
            elapsed_ms = elapsed * 1000

            stat_path = "mox.%s.request" % stat_route(request)

            profiler.statsd.timing(stat_path, elapsed_ms)
            _report_if_slow(request, elapsed)

    return profiler_tween

def _report_if_slow(request, total_time):
    for level, seconds in SLOWNESS_THRESHOLDS:
        if total_time >= seconds:
            _report_slow(request, total_time, level, seconds)
            break

def _report_slow(request, total_time, level, threshold):
    route = request.matched_route.name if request.matched_route else request.path_url
    message = "Request over %ss: %s %s" % (threshold, request.method, route)
    extra_data = {'seconds': total_time}
    payload_data = {'fingerprint': hashlib.sha1(message).hexdigest(), 'title': message}
    rollbar.report_message(message, level, request=request, extra_data=extra_data,
                           payload_data=payload_data)

'# To use, add the tween to your pyramid app, i.e.
'# app_config = Configurator(...)
'# app_config.add_tween('mox.lib.tweens.profiler.factory')
How to dive into this data using RQL
Rollbar provides various methods to dive into this data using RQL and the Metrics API.
Performance tips and tricks
Ensure to send async so as to not impact performance of your application code.
Track, Analyze and Manage Errors at Scale
Managing errors and exceptions in your code is challenging. It can make deploying production code an unnerving experience. Being able to track, analyze, and manage errors in real-time can help you to proceed with more confidence. Rollbar automates error monitoring and triaging, making fixing errors easier than ever. Sign Up Today!