Stack Traces
What are Stack Traces?
Debugging errors in your software often requires browsing stack traces (also called as backtraces or tracebacks). A stack trace is a sequence of stack frames which represents the chain of methods calling each other in your software. Rollbar collects your stack trace at the time a crash occurs – this way you will be able to know which pieces of code were active when an issue happened. You can find how to read stack traces in our previous blog post. In this post, we will show how we are making it easier and quicker for our users to investigate errors and resolve underlying issues.

How many Stack Traces does Rollbar receive?
Rollbar processes more than 70 million stack traces on an average day, coming from tens of thousands of software projects. We prepare stack traces to be more useful for debugging by organizing and linking them to other data sources. Adding code context to stack frames with SCM integrations like GitHub, and grouping duplicates into single items are just a couple of the processing pipelines stack traces go through to assist users. Lately we also aimed to reduce noise in the way we present stack traces in the Item Detail page.
How do Stack Traces vary across languages?
A typical stack trace from one programming language can differ from a stack trace from another programming language in many aspects.
For example, in Python the convention is to show the most recent call last. This means that as you browse through the chain of frames the last one contains the method that was called right before the crash happened. The exact opposite order is how Java stack traces are usually presented, that is, the most recent call is at the top.
Another aspect to look at is the length of the stack trace, i.e., how many frames are in it. Every developer who has worked with Java knows that Java tracebacks can be notoriously long, as opposed to Python, where tracebacks usually feel more comfortable to work with. These typical feelings are just impressions, not hard facts - however, using our data set of billions of crashes, we can show you how long they can really be.
Java & Python Comparison
To illustrate the length of stack traces, we took a sample of Java stack traces over a 6 months long period, removed duplicates, calculated the frame count in each traceback, and put the data in the histogram you see below.
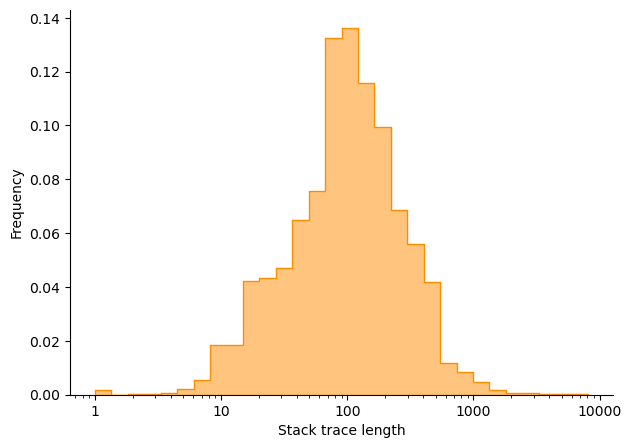
We can see that an average Java traceback contains about 100 frames. 50% of them are shorter than that, which means that the other 50% are longer than that. In fact, it’s not uncommon to see the length of Java tracebacks nearing the 1000s!
Let’s now compare these results to Python. With the same process as above, we plot the distribution of Python stack trace lengths next to Java.
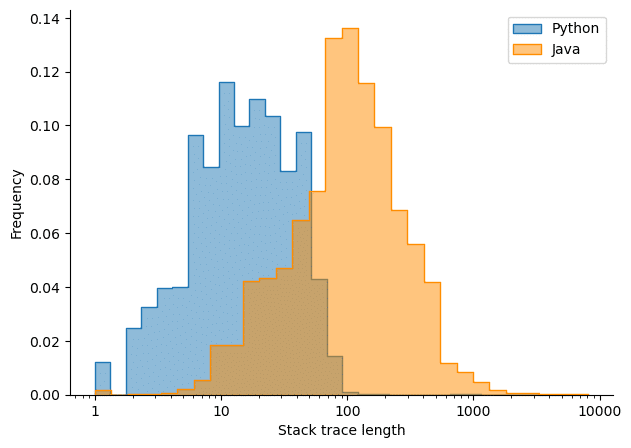
Our data perfectly shows that Python stack traces are indeed significantly shorter than Java ones. There is an order of magnitude difference here – an average Python traceback has a length of 10 as opposed to the average length of 100 in Java.
It’s interesting to take some time and think about the reasons for a moment. Java is famous for the substantial use of boilerplate code, which can have an effect on stack trace length. Another reason can be that Python is often used to write scripts, which are often shorter than full-fledged enterprise code which is the main use case of Java.
Project vs Non-Project Frames
What is the difference between a Project and a Non-Project Frame?
The frames in a stack trace can be put into two categories: in-project frames and non-project frames. In-project frames represent code from your own software projects, while non-project frames represent pieces of code from 3rd party libraries and language-specific internal code.
What benefits does detecting Non-Project frames provide?
The language internals and 3rd party libraries are an important part of your code as you develop your own project. For example, the Spring framework helps you write Java code more effectively, reducing development time spent on boilerplate code.
Although these libraries aren’t always perfect, when there’s an error in your system, the chances are that the bug lies in your own code rather than an extensively tested library used by millions of developers. That’s why Rollbar detects non-project frames and collapses them by default, so you can investigate first if your code is working properly or not.
How does Rollbar detect non-project frames?
Rollbar uses a combination of the user-provided server.root value and a blocklist of common non-project file paths to detect non-project frames. The blocklist is gathered by us from the billions of stack traces we analyze. What you as a Rollbar user can do is to properly configure the server.root field in your SDK and provide this information to us in your Occurrence data. This way, you will use Rollbar more efficiently in debugging and investigating your code.
Further information on how to do this can be found in our documentation.
Project vs Non-Project Frames Rate
We estimated the frequency of non-project frames on a random sample of 200K Java stack traces with a minimal length of 10 to see numbers on the extent of the noise they add to investigations. The result of this analysis is in the chart below.
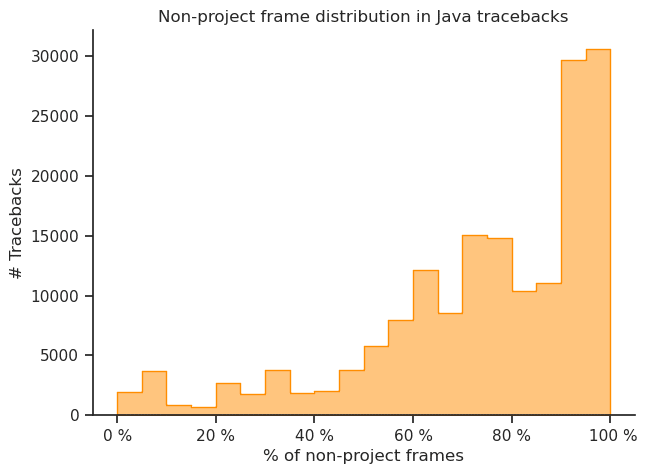
It turns out that the majority of Java tracebacks are indeed full of non-project frames. It is visible on the right side of the histogram that there are a lot of tracebacks where the percentage of non-project frames is above 90%. Another number that is quite telling is that every other Java stack traces the rate of non-project frames is more than 77%. This is the amount of frames that we aimed to detect and collapse by default.
Improving Non-Project Frame Detection
In our newest release we have significantly improved non-project frame detection in Java, as well as added improvements to Python and Ruby. With the release of these changes, we will detect and collapse a larger amount of non-project frames by default in the Item Detail page to help our users root cause issues in their own projects more efficiently.
Letting the numbers speak, we estimate that:
- Over 80% of Java errors will be improved in some way.
- Within these affected stack traces, over 70% of Java frames will be pushed into the background, making project code much more visible and helping to reduce investigation time.
These changes should significantly improve the investigation process for Java developers; also the improvements won’t stop with the release of this update.
In future, Rollbar users can expect to see substantial changes in non-project frame handling in other popular languages, such as Javascript, Go, C# and PHP.