Remember when debugging user issues meant asking them "can you tell me exactly what you were doing?" and getting responses like "I clicked the thing and it went whoosh"?
Those dark days are behind us thanks to session replay tools, which are like having a super-powered security camera for your app.
Let's look at some of the top players in this space and see how they're helping developers turn "works on my machine" into "works on every machine."
Rollbar

Rollbar stands out as the best session replay tool in 2026, particularly for developers who need to quickly understand and fix errors in production. Unlike traditional session replay tools that record everything (creating hours of footage to sift through), our approach is error-focused – we automatically capture sessions only when errors occur, showing you exactly what users were doing when things went wrong.
And it's built right into our error monitoring platform. Unlike standalone session replay tools, you get complete telemetry data linked to every session: console events, network calls, and logs automatically connected to user behavior. No switching between tools or hunting through dashboards.
Of course, if you want to record every session, we give you that flexibility too. You're always in control with flexible triggers. Whether it's critical errors only, specific user paths, custom events, or everything – you pick what matters. Plus our open-source MCP integration brings AI into the mix, allowing you to analyze sessions right in your IDE with support for VS Code, Cursor, and Claude Desktop..
Worried about slowing down your app? Don't be. We've kept the overhead super light, so your users won't even notice we're there. And yes, we're serious about privacy – our built-in PII scrubbing keeps sensitive user data safe by default. No more awkward moments of "I didn't mean to record that!"
The best part? We include 1,000 free session replays with every plan, no matter which tier you're on.
While we're obviously fans of our own approach, we know there are other tools out there that might fit different workflows. Let's take a look at some other tools in the market and what they offer – though we think you'll keep coming back to Rollbar!
Fullstory
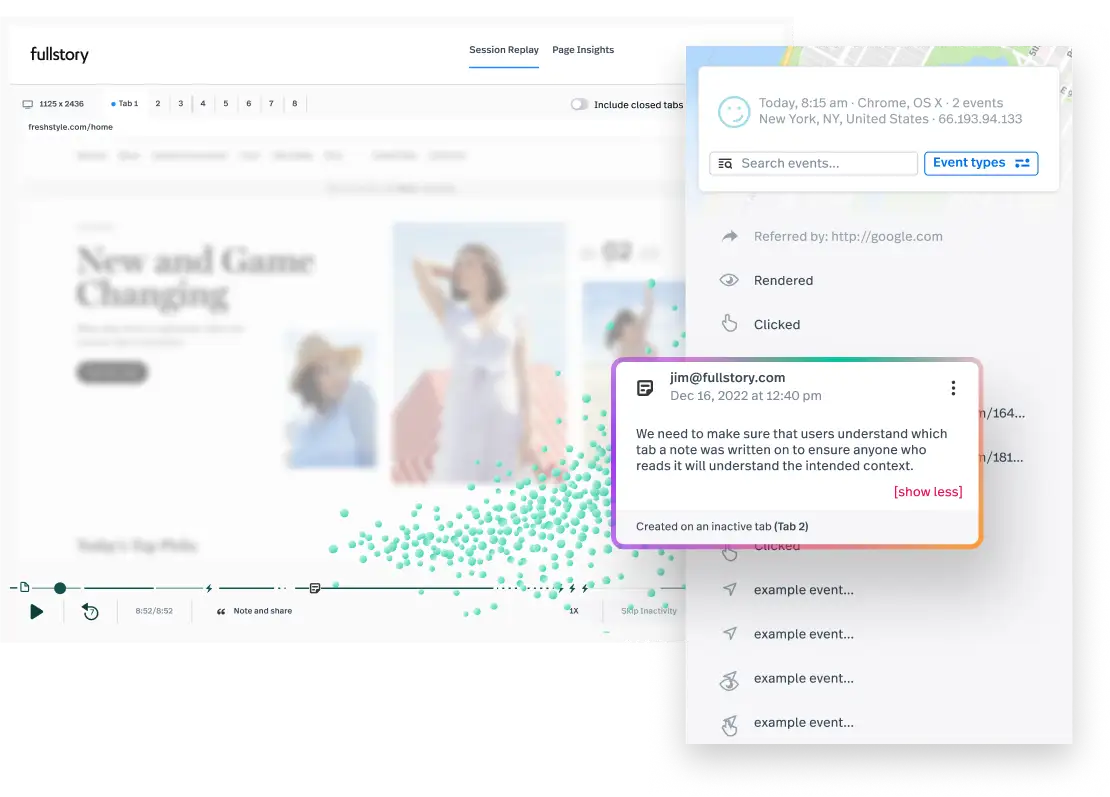
FullStory's session replay tool does more than just play back user sessions - it uses AI to generate quick summaries of what happened, which is super handy when you're trying to debug issues without watching hours of footage.
What really caught my eye though is their privacy approach - you can customize exactly what gets recorded and what gets masked out, which is crucial if you're dealing with sensitive data.
The tool automatically captures everything without requiring you to add special tags to your code (they call it "Fullcapture™"), and you can see all sorts of user behavior, even when people are jumping between multiple tabs.
FullStory also built in some neat features for tracking conversion funnels and generating heatmaps, so you can spot where users are getting stuck or dropping off. Basically, it's trying to be your all-in-one tool for understanding what's actually happening when users interact with your site or app.
Fullstory offers a two-week trial with 5,000 sessions, plus FullstoryFree—a permanent free tier launched in August 2025 with 30,000 sessions per month, 12-month data retention, and up to 10 user seats. For paid plans, their website says “contact us to discuss the plan option that will be best for your business.”
Dynatrace
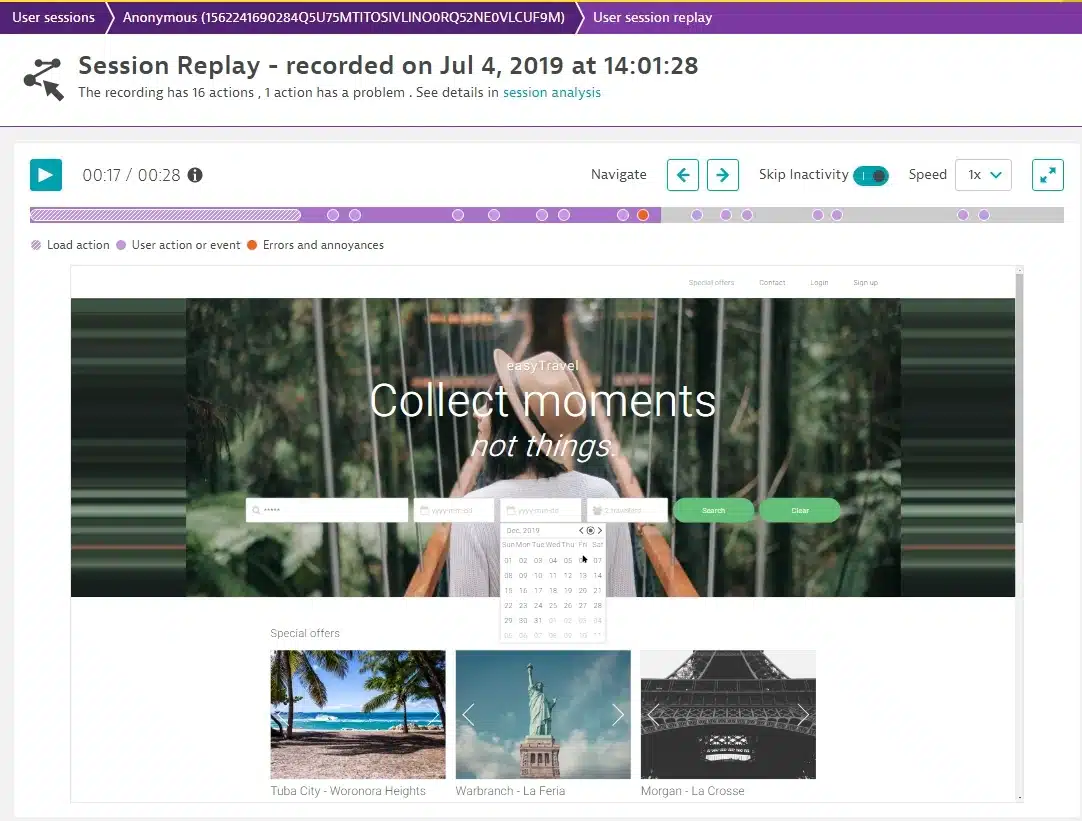
Dynatrace’s session replay tool is integrated with their broader observability platform. It's particularly useful for debugging because it ties user sessions directly to backend traces, so when something goes wrong, you can follow the trail from the user's clicks all the way to the server hiccup that caused it.
They've put a lot of thought into making it work with modern web tech - it handles single page apps and various JavaScript frameworks out of the box, plus it does Android and iOS stuff natively.
What's also cool is that they've built in these preset masking settings for privacy compliance (GDPR and all that jazz), so you're not accidentally recording sensitive data.
The big selling point seems to be that it's trying to be the bridge between frontend user experience and backend performance monitoring, which is pretty handy if you're already using Dynatrace for APM.
Dynatrace costs $0.0045 per session replay capture ($4.50 per 1,000 sessions) on top of their Dynatrace Platform Subscription.
Logrocket
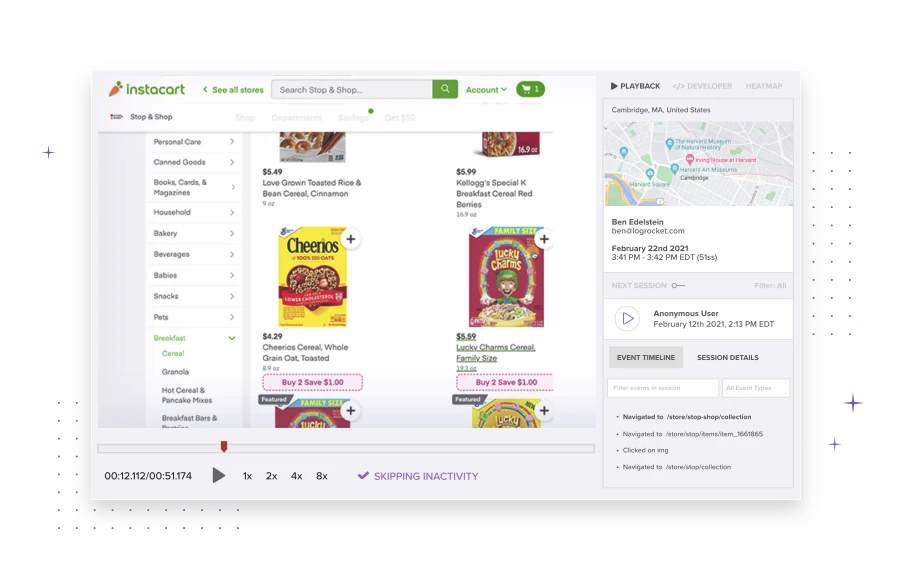
You can tell Logrocket’s session replay tool was built specifically with developers in mind. Beyond just showing you what users are doing, Logrocket captures all the nitty-gritty technical stuff like console logs, network requests, and JavaScript exceptions. They have some neat integrations with backend monitoring tools too like Datadog, so you can trace issues from the user's actions all the way to the server problems.
There’s a lot of emphasis on the performance aspect - they claim their script won't bog down your app's performance or mess with page load times.
And like others, they too have an AI thing that automatically watches and summarizes sessions for you, so you don't have to sit through hours of replays to figure out what went wrong. Their Galileo AI includes Highlights (watching up to 10 sessions simultaneously), automatic severity scoring, and daily/weekly digests via Slack, Teams, or email.
They're also pretty flexible with deployment - you can either use their SaaS version or self-host if you need to keep everything in-house. Self-hosting is available on the Enterprise plan with support for AWS, GCP, Azure, and Kubernetes.
Logrocket has a free plan with session replay that includes 1,000 sessions per month.
Datadog
What's neat about Datadog’s session replay tool is that since it's part of Datadog, you can tie it into their error tracking and APM tools, making it really useful for debugging complex issues where you need to see both the user's perspective and what's happening under the hood. They've also got all the enterprise-y stuff you'd expect - role-based access control, privacy features for sensitive data, etc.
They offer a heatmap feature that shows you where users are clicking most with three types: click maps, scroll maps, and top elements visualization, which is pretty handy for UX stuff. Datadog also introduced "RUM without Limits™" for 100% session capture with customizable retention filters, and extended retention options now reaching up to 15 months (from the 30-day default).
Datadog restructured its pricing in late 2025: Session Replay is now a separate add-on at $2.50 per 1,000 sessions (billed annually) on top of their Real User Monitoring (RUM) plans. RUM is required first and includes two tiers: RUM - Measure at $0.15 per 1,000 sessions and RUM - Investigate at $3.00 per 1,000 sessions. This means the total cost for session replay would be RUM + Session Replay combined (for example, $0.15 + $2.50 = $2.65 per 1,000 sessions with RUM - Measure). A 14-day free trial is available, though the free tier does not include Session Replay recordings.
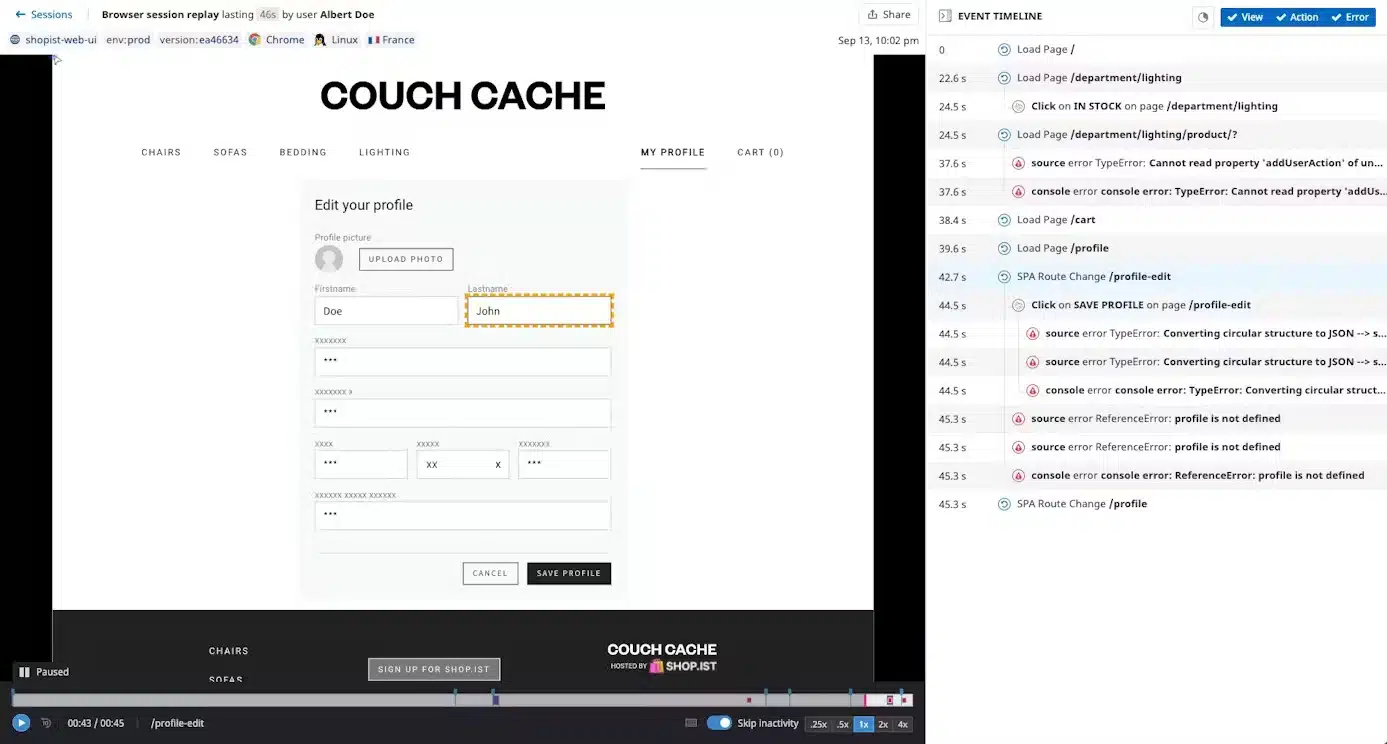
Sentry

If you’re already using Sentry for error monitoring, their session replay tool is super integrated - so when you get an error report, you can immediately jump into the replay of what the user was doing when things went wrong.
They've built in some developer-friendly features like access to console outputs, network calls, and even the DOM tree right in the replay view (basically like having Chrome DevTools inside Sentry).
One neat thing they've added recently is detection for "rage clicks" and "dead clicks" to help spot where users are getting frustrated. Sentry has also launched Replay AI Summaries (available for Early Adopters) that generate written session overviews with structured chapters.
The setup looks pretty straightforward too - just a few lines of code if you're already using their error monitoring. They've put a lot of emphasis on privacy, with options to mask sensitive data before it ever leaves the browser.
Sentry has a free plan for solo devs working on small projects that includes 50 session replays and 5,000 errors monitored per month.
👀 Ready to See What Your Users Saw?
In the world of debugging, context is king. And at the end of the day, what really matters is finding a solution that helps you fix bugs faster.
That's why we created Rollbar Session Replay with a laser focus on what developers actually need. Unlike rigid platforms that record everything by default, Rollbar puts you in control—whether you need focused error-triggered sessions or want to capture the complete user journey, you choose exactly what to record without unnecessary costs.
The best part? You can get started today with 1,000 free session replays included in every Rollbar plan. See for yourself how visual debugging can transform your workflow and help you build more reliable software.